Figure 4.
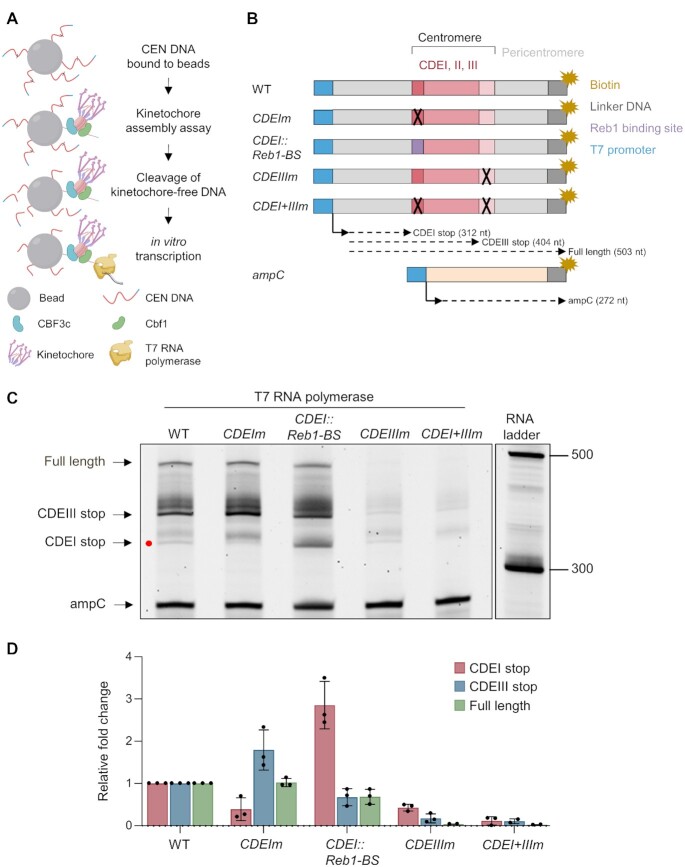
Cbf1 exhibits partial roadblock activity at yeast centromeres in vitro. (A) Diagram of the combined kinetochore assembly and T7 in vitro transcription experiment. First, kinetochores were assembled on the DNA templates presented in (B) and then any kinetochore-free DNA was cleaved by restriction digest. T7 RNA polymerase was added to initiate transcription and the resulting RNA products were purified and analyzed by migration on a TBE-Urea acrylamide gel. Cartoon was created with BioRender.com. (B) Schematic of the DNA templates used for the kinetochore assembly assay followed by T7 in vitro transcription. The templates include 250 bp from the E. coli ampC gene that encodes for β-lactamase (light orange) as an internal control; the 117 bp chromosome III centromere (WT); a mutant CEN3 (CDEIm) containing two point mutations in the CDEI element (black ‘X’) that abrogates Cbf1 binding, a mutant CEN3 (CDEI::Reb1-BS) where the 8bp CDEI element is replaced by the 10bp Reb1 consensus binding site (purple); a mutant CEN3 (CDEIIIm) containing three point mutations in the CDEIII element that abrogates CBF3 complex binding and kinetochore assembly; or a mutant CEN3 (CDEI + IIIm) containing both CDEI and CDEIII point mutations. The three Centromere-Determining Elements (CDEs) are indicated and are flanked by ∼300 bp in 5′ and 70 bp in 3′ of pericentromeric DNA and plasmid backbone (light grey). The DNA templates also contain linker DNA (dark grey) before the biotinylation (dark yellow star) at the 3′ end of the centromere. The CEN template is ∼500 bp. All templates include the 20 bp T7 promoter in 5′ (blue) and the site of transcription initiation is indicated by an arrow. Expected RNA products and associated sizes are indicated by the dashed arrows. (C) In vitro transcription of CEN DNA after kinetochore assembly. Purified RNA products were separated on a 6% TBE-Urea gel. The major discrete RNA products are indicated by the arrowheads. The band corresponding to the CDEI stop is indicated by a red dot. Sizes are given in nucleotides. Full size gel and negative control where T7 RNA polymerase was omitted is shown in Supplemental Figure S9B. (D) Quantification of each major RNA product from (C). Data were first normalized to the ampC signal then to the WT intensity. Error bars represent SD (n = 3).

