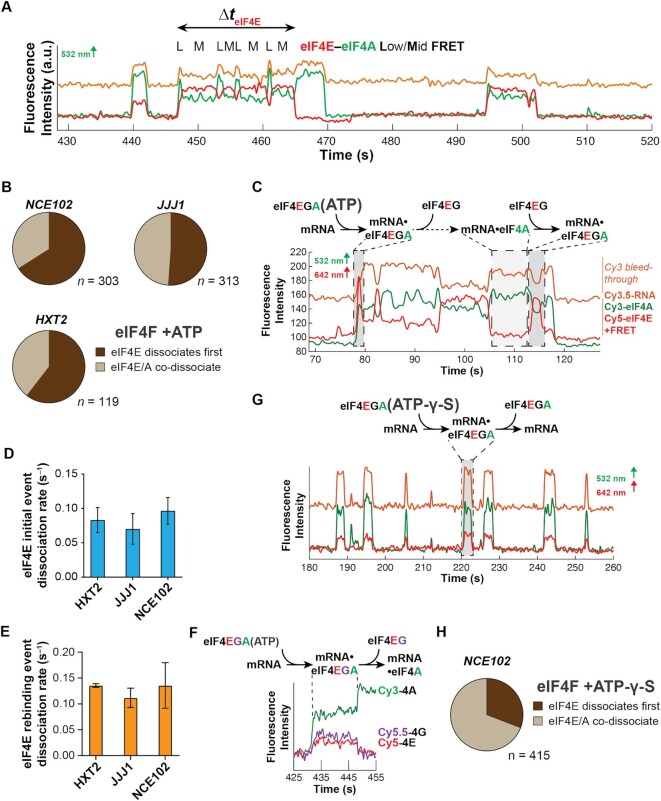
Figure 6.
Dynamic coordination within eIF4F after cap recognition. (A) Representative smFRET trajectory showing event with ejection of eIF4E prior to eIF4A, and fluctuations in the eIF4F•mRNA conformation on JJJ1. (B) Relative incidence of initial eIF4E dissociation vs. eIF4E/eIF4A co-dissociation from eIF4F•mRNA complexes. n is the number of molecules analyzed to enumerate the event types on each mRNA. (C) Reaction pathway and annotated representative single-molecule fluorescence trajectory for eIF4F•mRNA complex formation and dynamics, observed by dual red/green illumination which directly reports on the presence of both Cy3-eIF4A and Cy5-eIF4E. (D) Rates for the initial eIF4E–mRNA dissociation event after eIF4F–mRNA complex formation. (E) eIF4E–mRNA dissociation rates for events where eIF4E rebinds mRNA following initial dissociation from eIF4F•mRNA. (F) Reaction pathway and representative single-molecule fluorescence trajectory for a four-color experiment where eIF4G is non-specifically labeled with Cy5.5, allowing its simultaneous detection with Cy3-eIF4A and Cy5-eIF4E. eIF4E and eIF4G fluorescence co-depart the mRNA. (G) Reaction pathway and annotated representative single-molecule fluorescence trajectory for eIF4F•mRNA complex dynamics with ATP-γ-S. The Cy3 and Cy5 signals were manually corrected by linear subtraction to equalize their background values, for clarity of presentation. (H) Relative incidence of eIF4E or eIF4A dissociation, or co-dissociation from the eIF4F•mRNA complex in the presence of ATP-γ-S.

