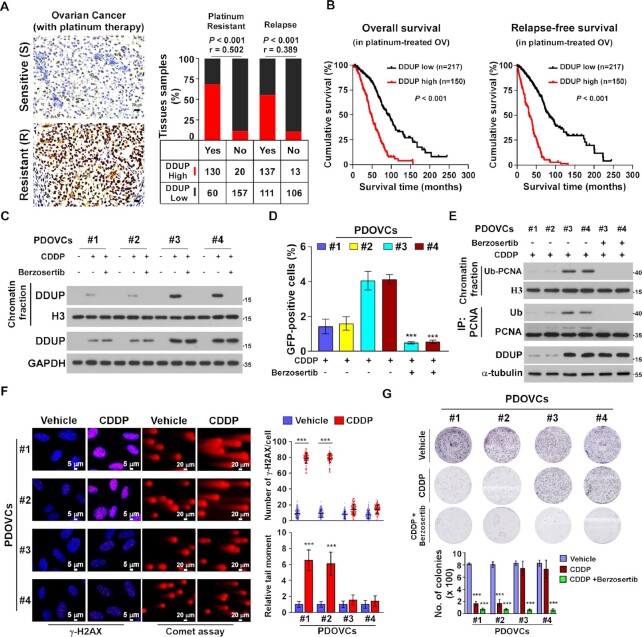
Figure 7.
Upregulation of DDUP confers resistance to cisplatin in ovarian cancer cells in vitro. (A) Representative images of DDUP expression in chemo-sensitive and chemo-resistant ovarian cancer cells (n = 367) (left) and the positive correlation between DDUP levels and platinum resistance (P < 0.001; r = 0.502) and relapse (P < 0.001; r = 0.389) in ovarian cancer tissues (n = 367; right). Scale bar = 20 μm. Chi-square test was used for statistical analysis. (B) Kaplan–Meier analysis of overall survival (left) and relapse-free survival (right) for patients with ovarian cancer stratified by low versus high expression of DDUP (log-rank test; p < 0.001; n = 367). (C) IB analysis of expression of DNA-bound and total DDUP in patient-derived ovarian cancer cells (PDOVCs). H3 and GAPDH served as a loading control. (D) Homologous recombination repair assays performed in PDOVCs transfected with DR-GFP and pCBAScel plasmids following treatment with CDDP (5 μM) alone or CDDP (5 μM) plus Berzosertib (80 nM) for 1 h. (E) IB analysis of expression of DNA-bound and total monoubiquitinated PCNA and DDUP in the indicated PDOVCs treated with CDDP (5 μM) alone or CDDP (5 μM) plus Berzosertib (80 nM) for 1 h. H3 and α-Tubulin served as loading control. (F) Representative images (left) and quantification (right) of γ-H2AX foci determined by IF staining using anti-γ-H2AX antibody and damaged DNA determined by comet assay in the indicated PDOVCs treated with CDDP (5 μM, 1 h). Scale bar = 5 μm (left) and 20 μm (right). (G) Representative images (upper) and quantification (lower) of the number of PDOVCs colonies following the indicated treatment. Each error bar represents the mean ± SD of three independent experiments (*P < 0.05, **P < 0.01, ***P < 0.001).

