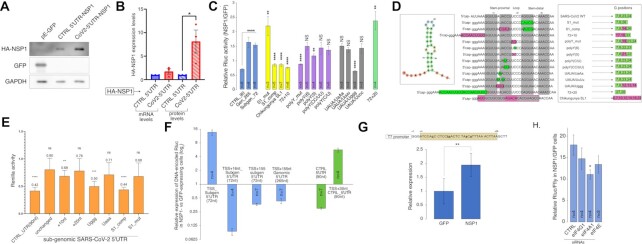
Figure 3.
Identification of RNA sequence that protects from NSP1-mediated repression. (A) MRC5 cells were transfected with plasmids encoding for eGFP, control 5′UTR-HA-NSP1 or CoV2-5′UTR-HA-NSP1 with its native 5′UTR immediately following the TSS (which is termed HA-NSP1 in this study). After 24 h, the cells were collected and 50 μg from the extracted total proteins were resolved on 9% SDS-PAGE and probed to detect the indicated proteins. (B) MRC5 cells were transfected with plasmids encoding the control 5′UTR-HA-NSP1 or CoV2-5′UTR-HA-NSP1, as detailed in (A), harvested after 24 h and split into two equal parts. One part was subjected to RNA isolation and subsequent RT-qPCR analysis to determine mRNA levels. The second part of each harvest was dedicated to the resolution of total proteins (50 μg) on SDS-PAGE and detection of the indicated proteins. Relative values of each biological repeat (n = 3) were plotted, the bars represent SE. (C) Impact of NSP1 on the expression of reporter mRNAs. MRC5 cells were transfected with plasmids encoding either eGFP or TSS-5′UTR-HA-NSP1. After 20 h, the indicated mRNA reporters bearing both 5′cap and poly(A) tail were transfected, and the luciferase activity was measured 7 h later. The number of independent biological repeats is indicated for each reporter, the bars indicate SE. P-values indicated for the blue columns refer to the reporter bearing the control 5′UTR (CTRL_90), while for the rest of the columns it refers to the reporter encoding the sub-genomic SARS-CoV2 5′UTR (Subgen_72). (D) Detailed representation of the site-directed mutagenesis. The leftmost panel represents the SL1 element's structure, as folded by ViennaRNA software. The middle panel shows detailed schemes representing the manipulations done on the 5′cap-proximal region of the viral 5′UTR. Changed moieties are squared; green squares imply no change to expression, pink squares imply reduced expression, grey shades mark the nucleotides participating in the stem structures. The rightmost panel shows the positions of guanosine moieties within the corresponding sequences relative to the 5′cap. The green color indicates unperturbed expression, while new locations of the ‘G’ moieties that reduce expression are indicated in pink. (E) In-vitro transcribed Rluc mRNA reporters described in (C) bearing both 5′caps and poly(A) tails were added to rabbit reticulocyte lysates (RRL) pre-incubated with either purified HA-NSP1 or BSA. Rluc activity was tested after 60 min of incubation. The graph shows the relative ability of NSP1 to inhibit the different mRNA reporters; n = 3, bars represent SD. (F) MRC5 cells were co-transfected with i) plasmid encoding the indicated configurations of 5′UTRs fused to the reporter Rluc gene and ii) plasmid encoding for either HA-NSP1 or eGFP. The cells were harvested after 48 h and subjected to the examination of Rluc activity; the number of biological repeats (n) is indicated separately for each combination; bars represent SE. (G) DNA template for in vitro transcription encoding the control plasmid-derived 5′UTR was subjected to site-directed mutagenesis in order to create a guanosine-free region, as depicted on the upper panel. mRNAs transcribed from these templates were capped and transfected into MRC5 cells expressing either HA-NSP1 or eGFP. Luciferase activity was measured 7 h later and plotted in a relative manner; n = 6, bars represent SD. (H) MRC5 cells were transfected with the indicated siRNAs and after 48 h transfected again with plasmids encoding (i) either HA-NSP1 or eGFP, (ii) TSS-subgen_5′UTR-Rluc and, (iii) Firefly (Ffly). After additional 24 h, luminescence was tested and Rluc values were normalized by Ffly signal and compared to cells transfected with the control non-targeting siRNAs for statistical analysis; n = 3 or 4, bars represent SE.

