Figure 5.
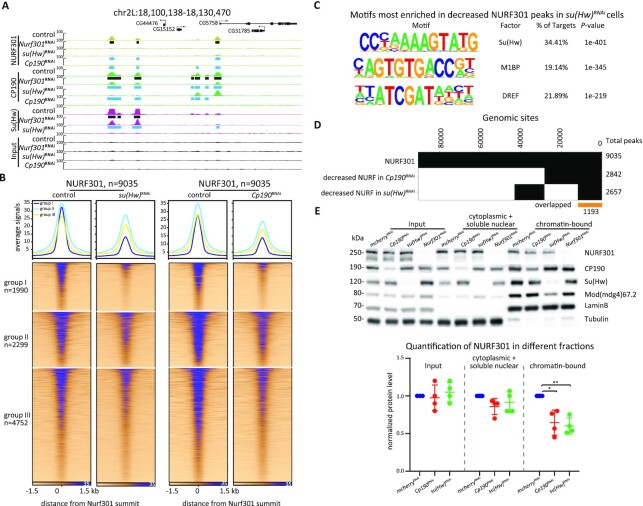
Su(Hw) assists the recruitment of NURF301 at a subset of sites. (A) Representative screenshot of decreased NURF301 after knockdown of Nurf301, su(Hw), or Cp190 in Kc cells. Cells were grown at 25°C. Peaks called in control samples are indicated by black rectangles, and decreased peaks in knockdown conditions are shown as blue rectangles. Three biological replicates were performed for each condition. (B) ChIP-seq signals for NURF301 are classified into three groups based on overlap with Su(Hw) (group I), location near TAD borders (group II), and remaining sites (group III) in control and Su(Hw)- or CP190-depleted cells. (C) Motif enrichment of decreased NURF301 peaks after depletion of Su(Hw). (D) Binary heatmap of NURF301 and decreased NURF301 after depletion of Su(Hw) or CP190. (E) Protein levels of NURF301, CP190, Su(Hw), and Mod(mdg4)67.2 in total cell lysate, cytoplasmic and soluble nuclear fraction, and chromatin-bound fractions of control and knockdown cells, as indicated. LaminB and Tubulin were blotted as a control for a chromatin-bound and cytoplasmic protein, respectively. Quantification of NURF301 protein level is graphed at the bottom. Data are from four biological replicates and paired t-test was used. *P < 0.05, **P < 0.01.

