Figure 6.
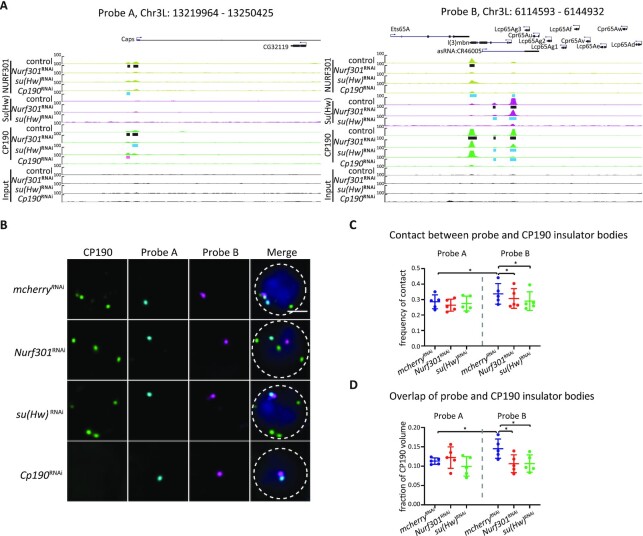
NURF301 specifically affects the co-localization of insulator bodies with gypsy insulator DNA binding sites in the nucleus. (A) Screenshot of the ChIP-seq profiles of CP190/Su(Hw)/Mod(mdg4)67.2/NURF301 in 30 kb probe regions. Black bars represent peaks identified by MACS2 in control Kc cells. Pink and blue rectangles indicate increased and decreased peaks in knockdown samples, respectively. Probe A was used as a control, which has no CP190/Su(Hw)/Mod(mdg4)67.2 colocalized sites (gypsy sites). Probe B has multiple sites with enriched signals of CP190/Su(Hw)/Mod(mdg4)67.2. (B) Representative images of CP190 immunostaining and Oligopaint FISH signals in Kc cells grown at 25°C after dsRNA treatment as indicated. Scale bar represents 2 μm. (C) Percentage of cells displaying contact between CP190 and respective probes. Data are from five biological replicates, each dot represents one biological replicate, n > 300 cells per replicate. (D) For cells showing contact in (C), average overlapped volume between CP190 and probes relative to CP190 volume. Overlap value was normalized to the volume of CP190 to exclude the bias of increased size of insulator bodies in Nurf301 and su(Hw) knockdown cells. Paired t-test was used, and error bars show standard deviation. ns, not significant; *P < 0.05 as indicated.

