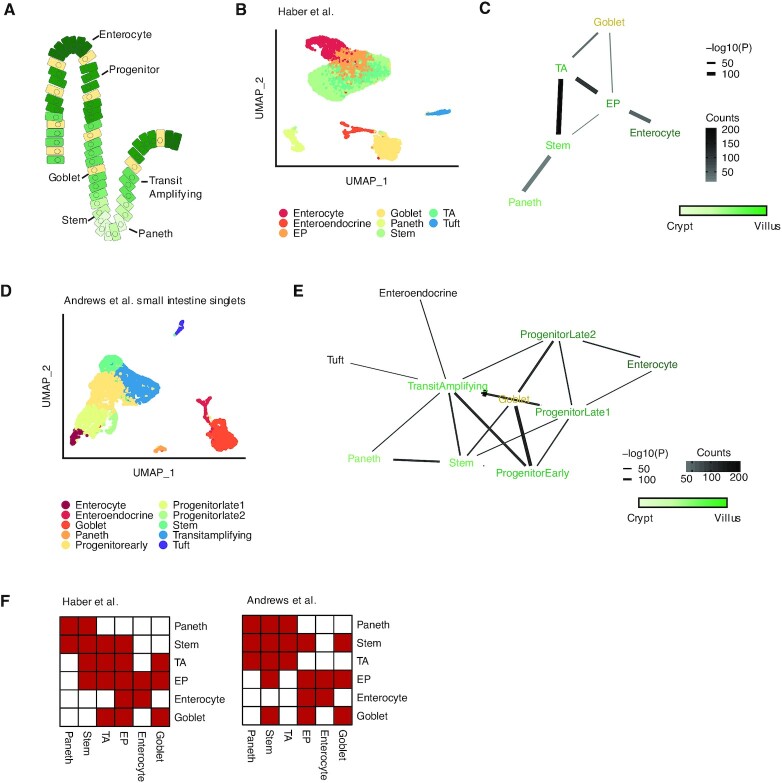
Figure 2.
Detecting known microanatomical features of the small intestinal epithelium. (A) Illustration of the main cell types in the small intestinal crypt and villus. (B) Uniform manifold approximation and projection (UMAP) of 11 665 small intestinal cells (21) from the duodenum, jejunum, and ileum (n = 2 mice) colored by cell type. TA, transit amplifying; EP, enterocyte progenitor. (C) Network diagram of significant cell type interactions from (B) identified by Neighbor-seq. Neighbor-seq is run for n = 10 iterations, and interactions are shown for edges with a mean count >10 and enrichment score combined adjusted P-value <0.05 (see Materials and Methods). Edge thickness represents interaction P-value and edge color represents counts. Green color scale represents anatomical progression from crypt to villus. (D) UMAP of 5279 cells from the small intestine (6) (n = 1 mouse) colored by cell type. Neighbor-seq is trained on these cells and used to predict the interaction network in a dataset of partially dissociated intestinal clumps. (E) Network diagram of significant cell type interactions identified by Neighbor-seq from 3671 small intestinal clumps. Methods, edge color and thickness, and colors scale are the same as in (C). (F) Adjacency matrix representation of the networks from (C) and (E). Cell labels were harmonized based on cell ontologies. Red color indicates the presence of a connection, white indicates no connection.

