Figure 6.
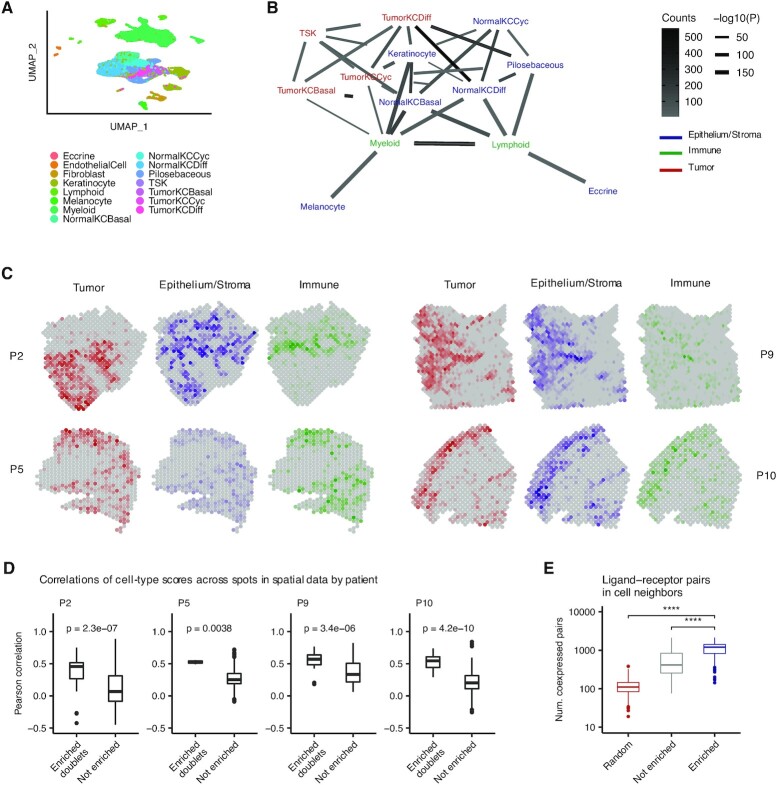
Identification of cell type interactions in skin cancer. (A) Uniform manifold approximation and projection (UMAP) of 48 164 primary human cells from n = 10 cutaneous squamous cell carcinomas (27) colored by cell type. TSK, tumor-specific keratinocyte; KC, keratinocyte; Cyc, cycling; Diff, differentiating. (B) Network diagram of significant cell type interactions from (A) identified by Neighbor-seq, colored by known cell compartment. Edge thickness represents interaction P-value and edge color represents counts. Neighbor-seq is run for n = 10 iterations, and interactions are shown for edges with a mean count >10 and enrichment score combined adjusted P-value <0.05 (see Materials and Methods). (C) Spatial transcriptomic maps of four patients (P2: n = 666, P5: n = 521, P9: n = 1145, P10: n = 608 barcodes) colored by cell-type abundance scores (see Materials and Methods). (D) Boxplots comparing spatial barcode cell-type abundance scores between cell-type pairs with enriched doublets from (B) compared to all other possible pairs. Boxplots show median (line), 25th and 75th percentiles (box) and 1.5× IQR (whiskers). Points represent outliers. Wilcoxon testing. (E) Comparison of the number of co-expressed ligand–receptor pairs in enriched (statistically significant) doublet types, not enriched doublets and random synthetic doublets from (A). Boxplots are the same as in (D).

