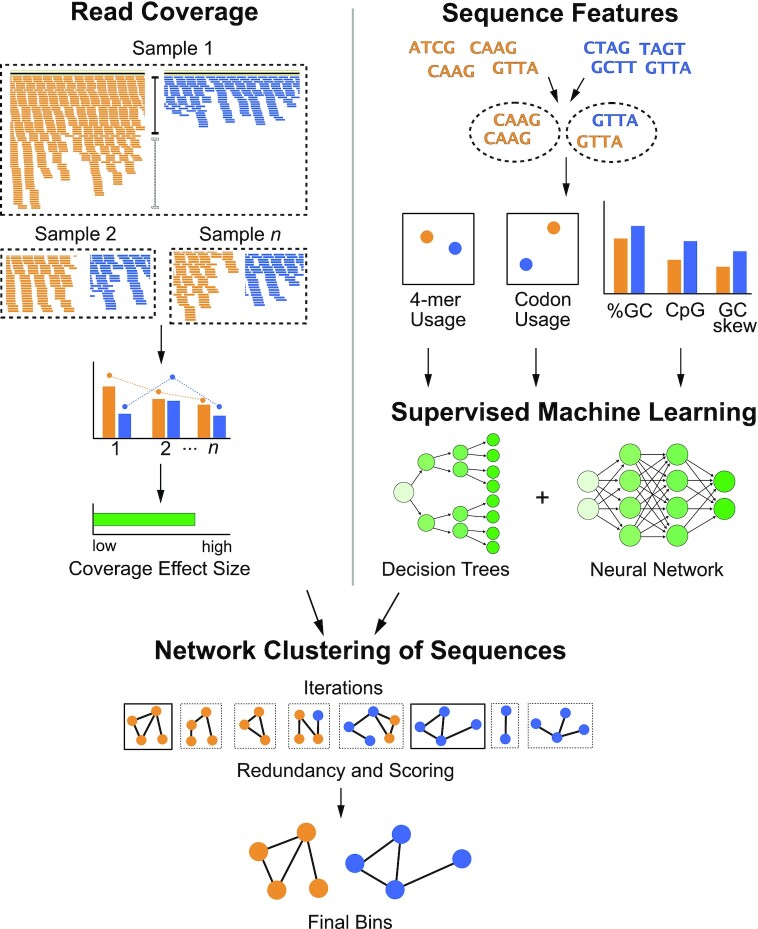
Figure 1.
Flowchart of vRhyme workflow and methodology. Scaffolds are compared pairwise by read coverage effect size differences using single or multiple samples (top-left), followed by sequence feature distance comparisons (top-right). Multiple iterations of network clustering of putative bins are generated with edge weights representing normalized coverage effect size and supervised machine learning probabilities of sequence feature similarity (center). The bins are refined by KMeans clustering, and the best set of bins from a single iteration are identified after identifying protein redundancy and scoring (bottom).

