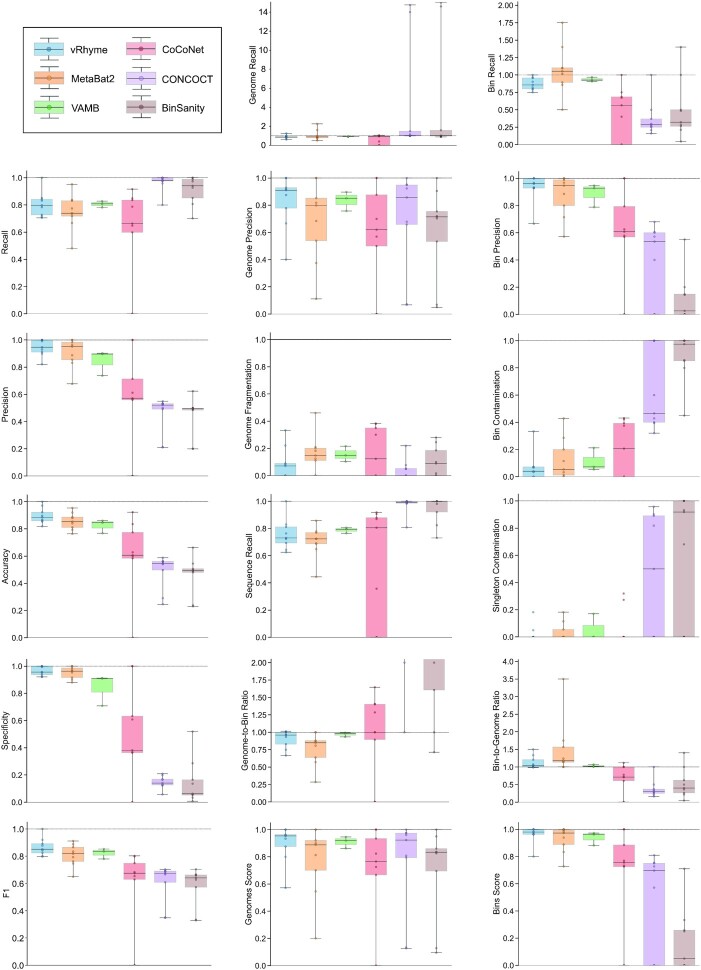
Figure 2.
Benchmarking performance metrics of vRhyme compared to MetaBat2, VAMB, CoCoNet, CONCOCT and BinSanity. Each boxplot represents the results of nine different datasets, except for VAMB in which three datasets are shown. In total, 999 non-redundant genomes artificially split into 4,324 sequence fragments are shown. For some plots, a dotted line is shown at 1.0 to indicate optimal performance. CONCOCT and BinSanity are partially shown on the Genome-to-Bin Ratio plot for better visualization; each yielded an average ratio >2.0.

