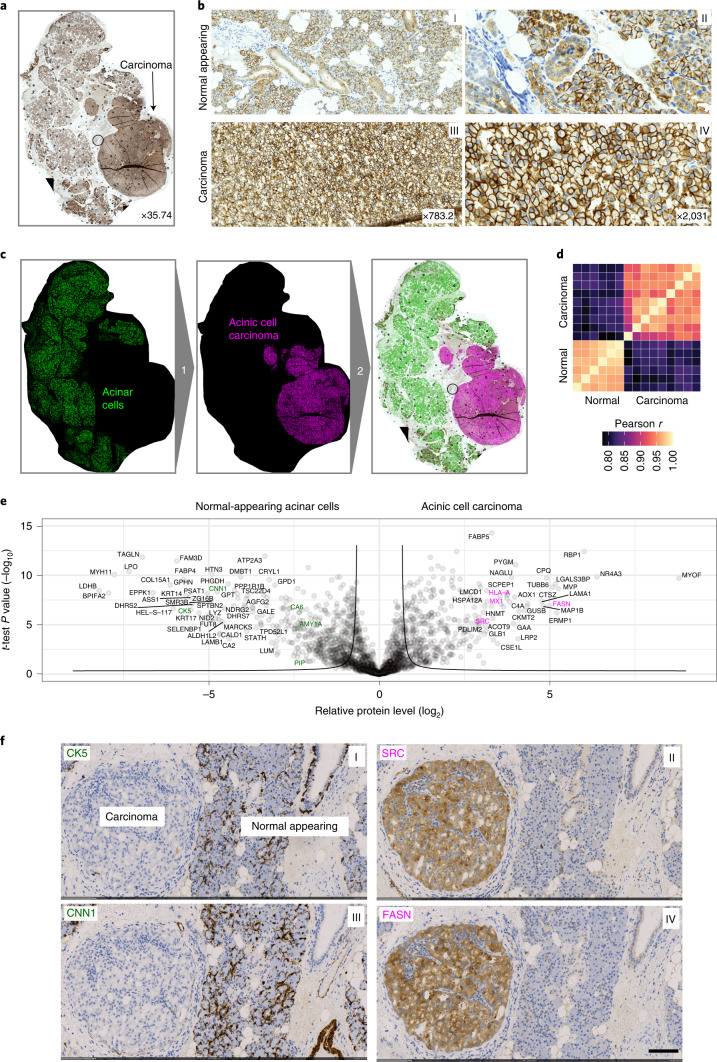
Fig. 4. DVP applied to archived tissue of a rare salivary gland carcinoma.
a, IHC staining of an acinic cell carcinoma of the salivary gland using the cell adhesion protein EpCAM. b, Representative regions from normal-appearing tissue (upper panels I and II) and acinic cell carcinoma (lower panels III and IV) from a. c, DVP workflow applied to the acinic cell carcinoma tissue. DL-based single cell detection of normal-appearing (green) and neoplastic (magenta) cells positive for EpCAM. Cell classification based on phenotypic features (form factor, area, solidity, perimeter and EpCAM intensity). d, Proteome correlations of replicates from normal-appearing (normal, n = 6) or cancer regions (cancer, n = 9). e, Volcano plot of pairwise proteomic comparison between normal and cancer tissue. t-test significant proteins (two-sided t-test, FDR < 0.05, s0 = 0.1, n = 6 biological replicates for normal and n = 9 for cancer) are highlighted by black lines. Proteins more highly expressed in normal tissue are highlighted in green on the volcanoʼs left, including known acinic cell markers (AMY1A, CA6 and PIP). Proteins more highly expressed in the acinic cell carcinoma are on the right in magenta, including the proto-oncogene SRC and interferon response proteins (MX1 and HLA-A; Supplementary Table 6). f, IHC validation of proteomic results. CNN1, SRC, CK5 and FASN are significantly enriched in normal or cancer tissue. Scale bar, 100 μm.

