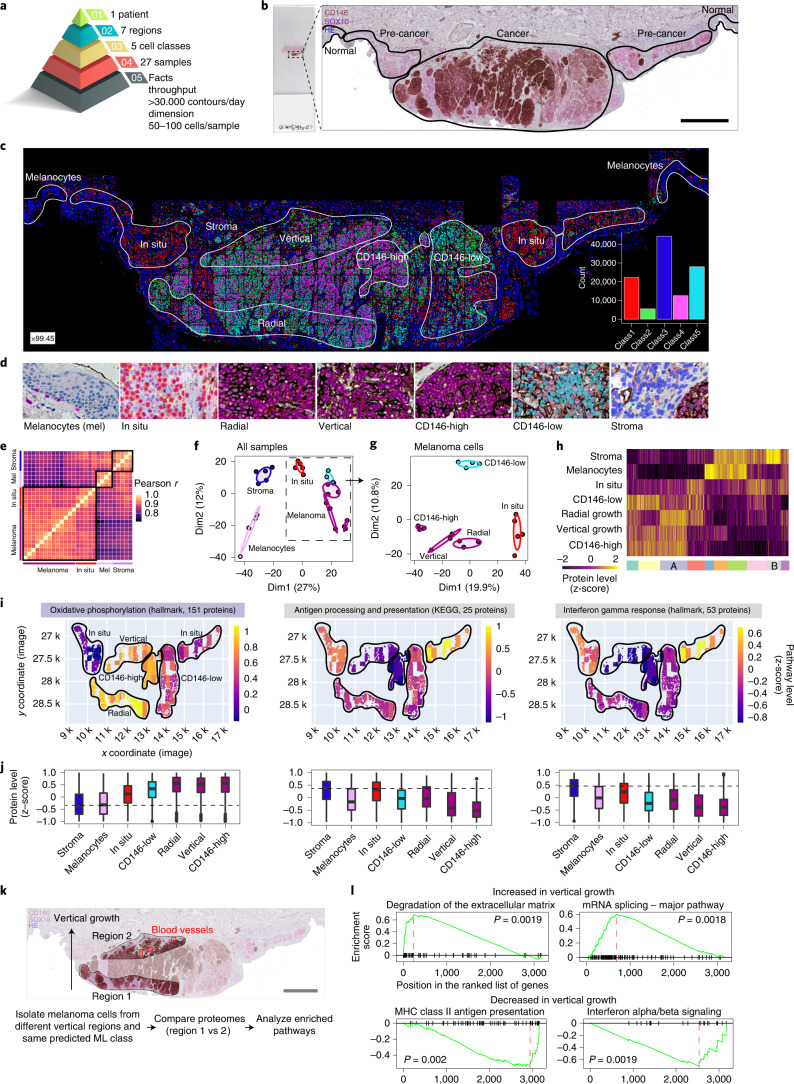
Fig. 5. DVP applied to archived primary melanoma tissue.
a, DVP sample isolation workflow to profile primary melanoma. b, DVP applied to primary melanoma immunohistochemically stained for the melanocyte marker SOX10 and the melanoma marker CD146. Left panel: stained melanoma tissue on a PEN glass membrane slide. Right panel: pathology-guided annotation of different tissue regions. Scale bar, 1 mm. c, Pathologist-guided and ML-based cell classification based on CD146 and SOX10 staining intensity and spatial localization: normal melanocytes, stromal cells, melanoma in situ, CD146-low melanoma, CD146-high melanoma, radial growth melanoma and vertical growth melanoma. Right lower panel: frequency of classes predicted by unsupervised ML (k-means clustering). d, Example pictures of the seven identified classes. Magnification factor = ×4,400. e, Correlation matrix (Pearson r) of all 27 measured proteome samples. f, PCA of proteomes. g, PCA of all melanoma-specific proteomes from in situ to invasive (vertical growth) melanoma. h, Unsupervised hierarchical clustering based on all 1,910 ANOVA significant (FDR < 0.05) protein groups. Two clusters of upregulated (cluster A) or downregulated (cluster B) proteins in invasive melanoma are highlighted. i, Tissue heat map mapping the proteomics results onto the imaging data. Relative pathway levels of selected terms from the two clusters are highlighted in i. Median protein levels were calculated per annotation and plotted for each isolated cell class against their x and y coordinates, as defined by their segmented cellular contours. j, Box plots of z-scored protein levels for the differentially regulated pathways visualized in i above. The box plots define the range of the data (whiskers), 25th and 75th percentiles (box) and medians (solid line). Outliers are plotted as individual dots outside the whiskers. k, Comparing proteomic changes in CD146-high melanoma cells (class 4) of the vertical growth (region 2) with the radial growth (region 1). Blood vessels in proximity to melanoma cells of the vertical growth are highlighted in red. Scale bar, 1 mm. l, Gene set enrichment analysis plot of significantly enriched pathways for melanoma cells of the vertical and radial growth phase. Pathway enrichment analysis was based on the protein fold change between vertical and radial melanoma cells and performed with the ClusterProfiler R package36. Enriched terms with an FDR < 0.05 are shown. MHC, major histocompatibility complex.

