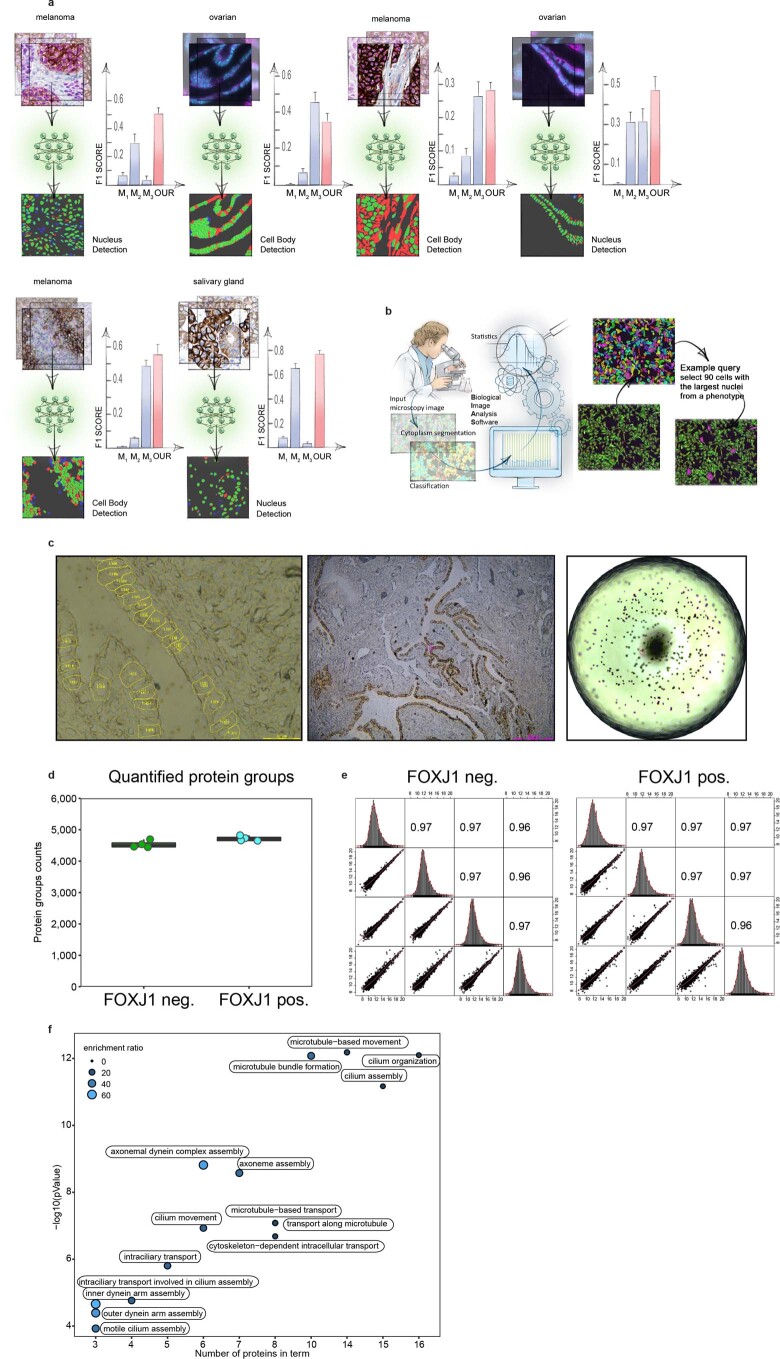
Extended Data Fig. 1. Benchmarking of segmentation algorithm.
a, Cell body and nuclei segmentation of melanoma, salivary gland and fallopian tube tissue using the Biological Image Analysis Software (BIAS). We benchmarked the accuracy of our segmentation approach using the F1 metric and compared results to three additional methods M1-M3. unet4nuclei (M1)6, CellProfiler (M2)8, CellPose (M3)7, while OUR refers to nucleAIzer3. Bars show mean F1-scores with SEM (standard error of the mean). Visual representation of the segmentation results: green areas correspond to true positive, blue to false positive and red to false negative. Data provided in Table 1 and Supplementary Table 1. b, BIAS allows the processing of multiple 2D and 3D microscopy image file formats. Examples for image pre-processing, deep learning-based image segmentation, feature extraction and machine learning-based phenotype classification. c, Left: Contour alignment in the LMD7 software before laser microdissection of fallopian tube epithelial cells. Middle: Screenshot after laser microdissection. Right: 384-well inspection after laser microdissection in individual fallopian tube epithelial cells. d, Number of quantified proteins per replicate of FOXJ1 positive and negative epithelial cells. Samples were acquired in data-independent mode and analyzed with the DIA-NN software. e, Replicate correlations of proteome measurements. Correlation values show Pearson correlations. f, Pathway enrichment analysis for proteins significantly higher in ciliated cells compared to secretory fallopian tube epithelial cells.

