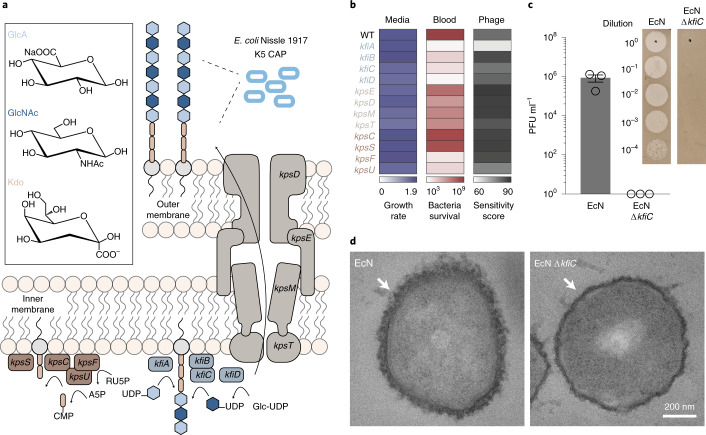
Fig. 2. sRNA knockdown screen identifies key genes in CAP biosynthesis.
a, Schematic of K5 CAP biosynthesis in EcN. CAP is composed of an alternating polymer chain of GlcA and GlcNAc connected to a poly-Kdo linker. Subsequently, CAP is transported from the inner bacteria membrane to the outer membrane. b, Quantification of microbial growth parameters of EcN KD strains in nutrient-rich media (LB), blood or phage-containing media. Growth rate denotes maximum specific growth rate (h−1) obtained by fitting growth curve to measured OD600 over time. Blood viability is defined as bacterial CFU ml−1 after 6-hour incubation in human blood. Phage sensitivity is calculated by area under the curve of bacterial turbidity over 6 hours of incubation with LB media containing ΦK1-5. c, Phage sensitivity of EcN and EcN ΔkfiC. Plaque-forming assay demonstrates complete absence of infection and lysis in EcN ΔkfiC. The representative images show difference between serially diluted PFU of bacteria with and without CAP. Error bars represent s.e.m. over three independent samples. d, TEM images showing CAP encapsulation of the cellular outer surface. kfiC KO results in the absence of CAP nanostructure on the cell surface of EcN ΔkfiC. White arrows indicate cell surface. WT, wild-type.

