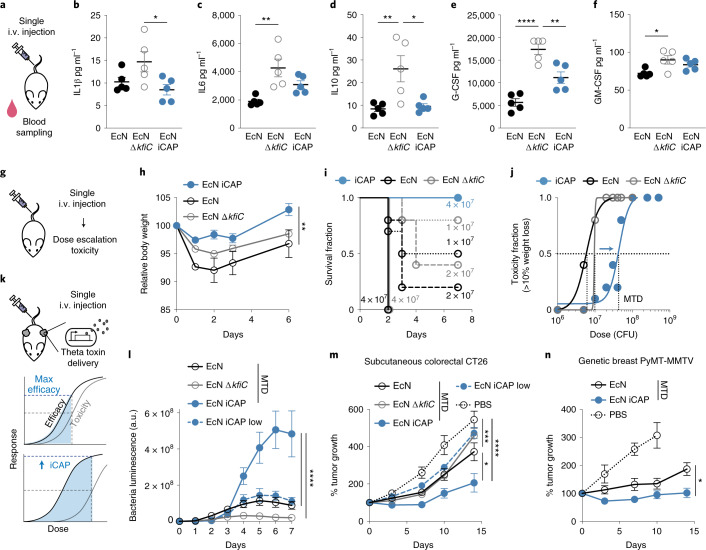
Fig. 5. Transient CAP activation improves systemic bacterial delivery and efficacy in vivo.
a, Host response was evaluated after bacterial administration in mice. EcN iCAP was pre-induced with 10 µM IPTG and allowed to gradually attenuate CAP over time. b–f, Serum cytokine levels after 5 × 10⁶ CFU bacterial administration. IL1β (b, *P = 0.039 at 4 hours p.i.), IL6 (c, **P = 0.0037 at 4 hours p.i.), IL10 (d, **P = 0.0089 and *P = 0.014, respectively, at 24 hours p.i.), G-CSF (e, ****P < 0.0001 and **P < 0.01, respectively, at 24 hours p.i.) and GM-CSF (f, *P = 0.019 at 4 hours p.i.) were measured. g, Toxicity was evaluated by bacterial administration with elevating doses. h, Change in animal body weight after i.v. bacterial administration at 5 × 10⁶ CFU (**P = 0.004; n = 10, 5 and 5 mice for EcN iCAP, EcN and EcN ΔkfiC groups, respectively). i, Survival curve (>15% body weight reduction; n ≥ 5 mice per group) after bacterial administration at 1~7 × 10⁷ CFU. j, Dose–toxicity curve with MTD = 4.4 × 10⁷ CFU, 5.8 × 10⁶ CFU and 9.6 × 10⁶ CFU for EcN iCAP, EcN and EcN ΔkfiC, respectively. MTD was calculated based on TD50 (>10% body weight drops p.i.; non-linear regression with least squares fit; n ≥ 5 per group). k, Mice bearing tumors were intravenously injected with EcN MTD, EcN ΔkfiC MTD and EcN iCAP MTD (pre-induced with 10 µM IPTG) or EcN iCAP low (pre-induced with 10 µM IPTG) at 5 × 10⁶, 1 × 10⁷, 5 × 10⁷ or 5 × 10⁶ CFU, respectively. Bacteria were engineered to produce TT. l, Bacterial growth trajectories in subcutaneous CT26 tumors measured by bacterial luminescence (****P < 0.0001; n = 14, 13, 9 and 13 tumors for EcN MTD, EcN ΔkfiC MTD, EcN iCAP MTD and EcN iCAP low groups, respectively). Luminescence values are normalized to basal luminescence of individual strains. m, n, Therapeutic efficacy measured by relative tumor size over time in a syngeneic CT26 model (m; ****P < 0.0001, ***P = 0.0008, **P = 0.003; n = 14, 13, 9, 13 and 11 tumors for EcN MTD, EcN ΔkfiC MTD, EcN iCAP MTD, EcN iCAP low and PBS groups, respectively) and in a genetically engineered spontaneous breast cancer MMTV-PyMT mouse model (n; *P = 0.0197; n = 15, 15 and 9 tumors for EcN MTD, EcN iCAP MTD and PBS groups, respectively). MMTV-PyMT tumors were measured by calipering three orthotopic regions in mammary glands (upper left, upper right and bottom). Mice in PBS groups reached study endpoint 10 days p.i. Statistical analyses were performed using one-way ANOVA (b–f) and two-way ANOVA (h, i–n) with Tukey’s multiple comparison test. Bacteria were engineered to produce TT (l–n). All error bars represent s.e.m. over three independent samples unless otherwise noted. All ‘n’ denotes number of biological replicates. a.u., arbitrary units; GM-CSF, granulocyte–macrophage colony-stimulating factor; p.i., post injection.

