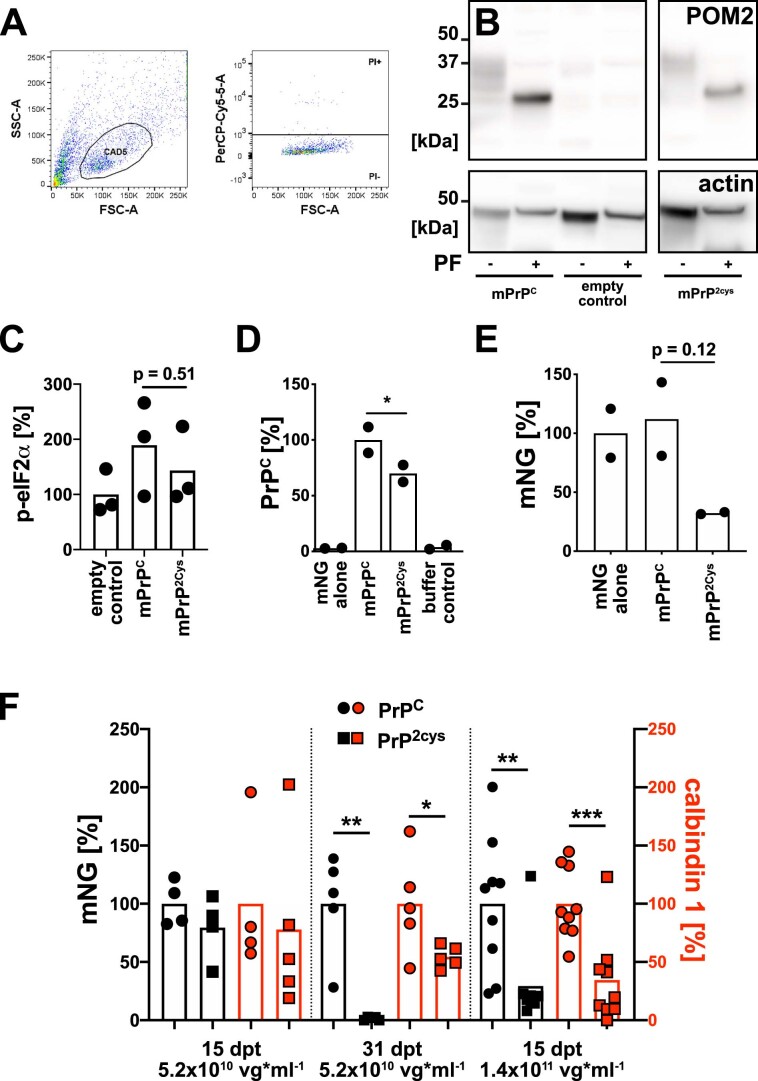
Extended Data Fig. 3. Expression of the H-latch mimic R207C-I138C in organotypic cultured slices leads to dose-dependent neurotoxicity.
(a) Flow cytometry gating strategy of PI positive CAD5 cells. (b) PNGase-F digestion of cell lysates induced a shift in both murine wild-type PrPC and mPrP2cys, indicating that both moieties had undergone N-linked glycosylation to a similar extent. Non-adjacent lanes were merged from the same gel. (c) CAD5 Prnp-/- cells expressing mPrP2cys did not show an upregulation of the unfolded protein response, suggesting that mPrP2cys did not undergo pathological degradation. Values are given as percentage of empty control vector (p-eIF2α / eIF2α / actin). One datapoint per group corresponds to a different cell culture passage. Two-sided, unpaired t-test. (d) A POM2/POM3 sandwich ELISA of COCS transduced with empty control, mPrPC, mPrP2cys and buffer control shows robust mPrP2cys expression in transduced COCS, albeit significantly less than wild-type mPrPC. Slices were harvested at 28 days post-transduction. One datapoint corresponds to an independent, biological replicate of 6–9 pooled slices. Ordinary, one-way Anova with Šídák’s multiple comparisons test, *: adjusted p-value = 0.039 (e) Reduced levels of mNG in Prnp-/- (ZH3) COCS expressing mPrP2cys. mNG immunoreactivity values are divided by actin immunoreactivity and expressed as percentages of empty control. Slices were harvested at 28 days post-transduction. One datapoint corresponds to an independent, biological replicate of 6–9 pooled slices. Ordinary, one-way Anova with Šídák’s multiple comparisons test. Raw, uncropped blots can be found in the Source Data supplement. (f) Quantification of mNG and Calb1 fluorescence intensity from experiments shown in Fig. 3d-f. One datapoint corresponds to a biological replicate, e.g. one organotypic cultured slice. Unpaired, two-tailed t-test without adjustment for multiple testing. P-values are as follows: 31 dpt, 5.2x10¹⁰ vg*ml−1, mNG: 0.001; 31 dpt, 5.2x10¹⁰ vg*ml−1, Calb1: 0.0496; 15 dpt, 1.4x10¹¹ vg*ml−1, mNG: 0.0065; 15 dpt, 1.4x10¹¹ vg*ml−1, Calb1: 0.001. ***: p ≤ 0.001, **: p < 0.01, * p < 0.05.

