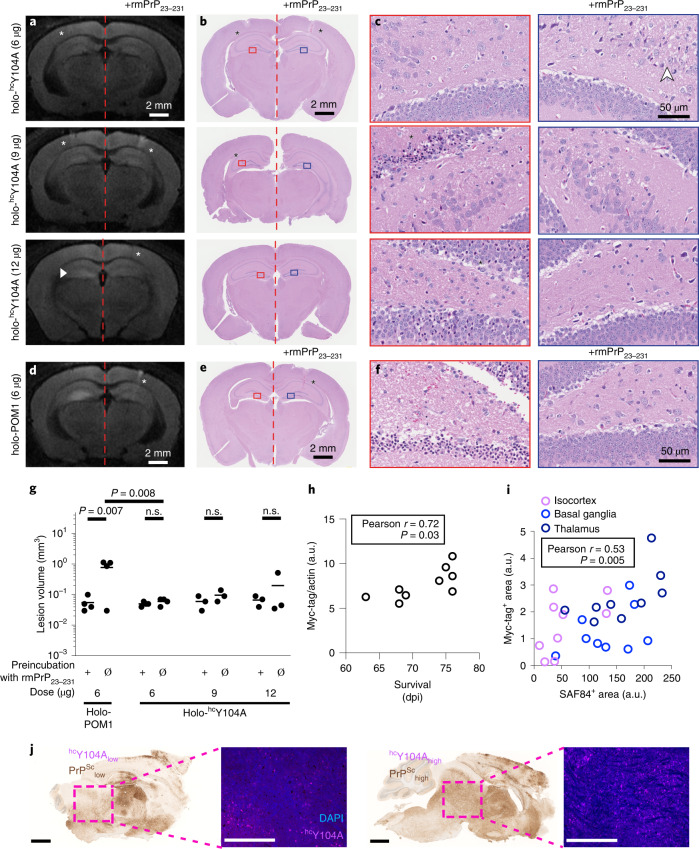
Fig. 6. The holo-IgG antibody hcY104A is innocuous after intracerebral injection.
a, Representative magnetic resonance diffusion-weighted images (DWI) 24 hours after stereotactic injection of holo-hcY104A (left). Contralateral injections of holo-hcY104A + rmPrP23231 (right). A small area of hyperintensity was found in one mouse after injection of 12 µg holo-hcY104A (white arrowhead). White asterisks: needle tract. b, Hematoxylin and eosin (HE)-stained sections from mice shown in a. Asterisks: needle tract. Rectangles denote regions magnified in c. c, HE sections (CA4). Left, holo-hcY104A injections (6, 9 and 12 µg). Right, holo-hcY104A + rmPrP23–230. Asterisk (9 µg): neurons with hypereosinophilic cytoplasm and nuclear condensation in the vicinity of the needle tract. Asterisk (12 µg): These neurons were diffusely distributed among numerous healthy neurons. White arrowhead: vacuoles indicative of edema along the needle tract. d, DWI images of 6 µg holo-POM1 ± rmPrP23–231, revealing a hyperintense signal at 24 hours. e, HE-stained section from a mouse shown in d. Asterisks: needle tract. Rectangles: areas in f. f, HE sections (CA4). Holo-POM1 injections revealed damaged neurons with condensed chromatin and hypereosinophilc cytoplasm. g, Volumetric quantification of lesions on DWI imaging 24 hours after injection revealed no significant lesion induction by holo-hcY104A. One datapoint corresponds to an animal. P values are adjusted for multiple comparisons. n.s.: not significant, P > 0.05, ordinary one-way ANOVA with Šídák’s multiple comparisons test. h, Antibody expression levels, as determined by Myc-Tag western blot, showed a positive correlation with survival. One datapoint corresponds to one animal. Pearson correlation coefficient r = 0.72, 95% confidence interval 0.099–0.94, P = 0.03. a.u., arbitrary units. i, Significant correlation of PrPSc and antibody expression levels (representative images depicted in j, aggregated correlation across all brain regions). Different colors represent 3 brain regions from 9 independent animals. Pearson correlation coefficient r = 0.53, 95% confidence interval 0.18–0.76, P = 0.0048. j, Representative images from quantification of l. l, Sagittal brain sections stained with SAF84, highlighting PrPSc, and basal ganglia immunofluorescent micrographs marking hcY104A-Myc-tag. Scale bar SAF84: 1 mm. Scale bar hcY104A-Myc-tag: 500 µm.

