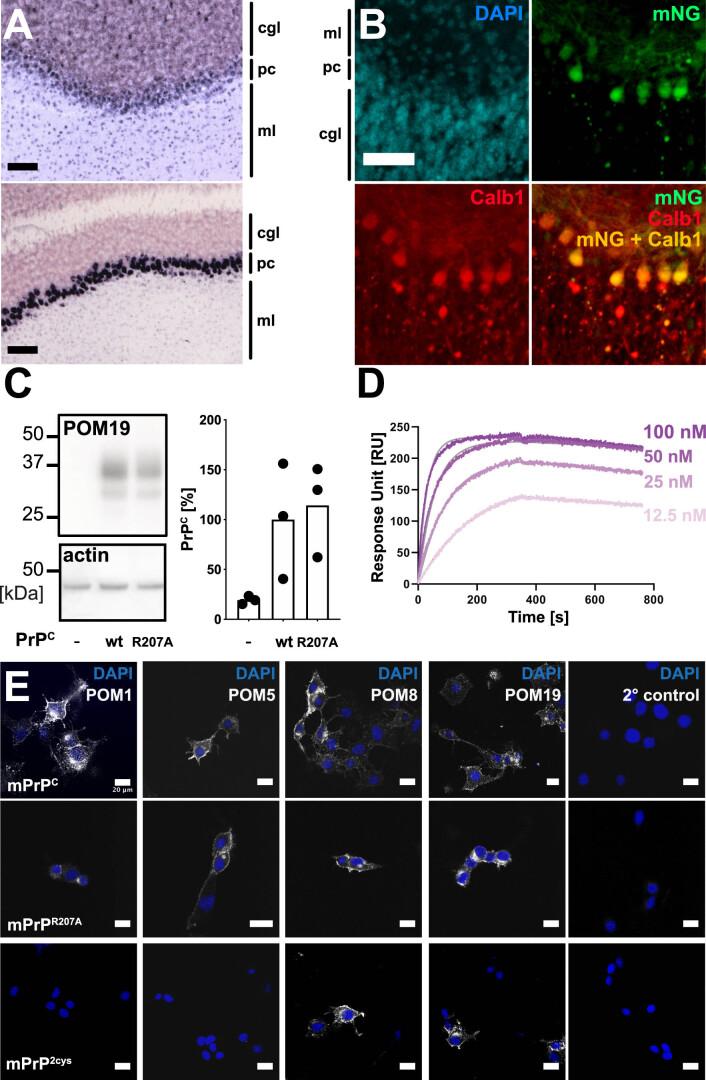
Extended Data Fig. 2. Robust expression and conformation of the PrPR207A point mutant.
(a) Representative images of expression levels of Synapsin 1 (Syn1, upper) and Calbindin 1 (Calb1, lower) show predominant (Syn1) or almost exclusive (Calb1) expression in Purkinje cells (pc) in the cerebellar cortex. Image credit: Allen Institute. Scale bar = 100 µm. (b) Fluorescent micrographs of PrnpZH3/ZH3 COCS transduced with the AAV outlined in panel (A) show mNeonGreen expression predominantly in calbindin 1-expressing Purkinje cells. Scale bar = 50 µm. cgl = cerebellar internal granular layer, pc = Purkinje cell layer, ml = molecular layer. These findings were repeated in three independent experiments. (c) Left panel: Stably transfected CAD5-mPrPC and CAD5-mPrPR207A cells show similar PrPC expression levels. epresentative PrPC levels of one cell culture passage are shown. Right panel: POM19 immunoreactivity is divided by actin immunoreactivity, values are given as percentages of PrPC. One datapoint corresponds to one passage of CAD5 cells. (d) Surface plasmon resonance (SPR) traces showing binding of POM1 to recombinant mPrPR207A (rmPrPR207A, ka=3.8E+05 1/Ms, kd=1.8E−04 1/s, KD=4.7E−10 M; for comparison binding to recombinant wild-type murine PrP showed ka=3.6E+05 1/Ms; kd=9.1E−05 1/s; KD=2.5E−10 M). (e) Immunohistochemistry of CAD5 Prnp-/- cells stably transfected with pcDNA3.1 vector expressing wild-type murine PrPC (mPrPC), mPrPR207A and mPrP2cys. Monoclonal anti-PrPC antibodies targeting distinct conformational epitopes on the globular domain of PrPC were incubated to assess conformational changes in mPrPR207A (POM1: α1-α3, POM5: β2-α2, POM8: α1-α2, POM19: β1-α3). Except for diminished staining of POM1 in mPrPR207A, we observed robust detection of mPrPR207A by POM5, POM8 and POM19 and mPrP2cys by POM8 and POM19. Parts of this experiment, for example POM1 and POM19, were repeated twice. Scale bar = 20 µm.

