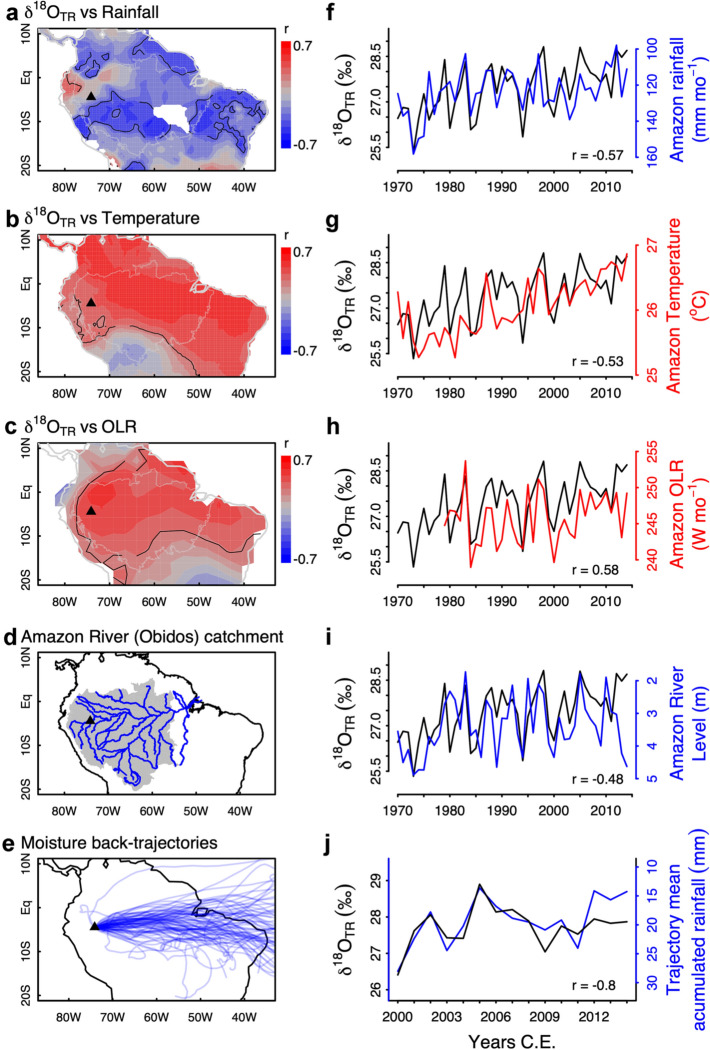
Fig. 1.
Association of the δ18OTR record obtained from Macrolobium acaciifolium floodplain trees from western Peru with rainfall (a, f), temperature (b, g) from CRUTS 4.04, OLR (c, h) from NOAA, Amazon river at Obidos (d, i) from ANA/Brazil and accumulated precipitation along moisture trajectories from the sampling site (e, j) estimated from TRMM 3B42. Panels (a–c) show spatial correlation maps, with solid contours indicating regions with p < 0.05, and thin gray lines indicating the area used to average climate data for (f, g, h). Panel (d) shows the drainage area of the Amazon River at Obidos in grey shading and panel (e) shows the back-trajectories of moisture from the sampling site calculated for the height of 600 Pa. Panels (f–j) show time series comparisons of the δ18OTR record with respective climate/river variables shown in (a–e), with blue lines indicating negative correlations shown with inverted y-axis. Amazon rainfall, temperature and OLR are shown as monthly means of dry season months from June to October. Accumulated rainfall (i) is shown as trajectory means from June to August. Amazon river levels are shown as monthly means from September to November. Correlation coefficients with all variables are shown in Table 1 and in Online Resource SIFig. 4

