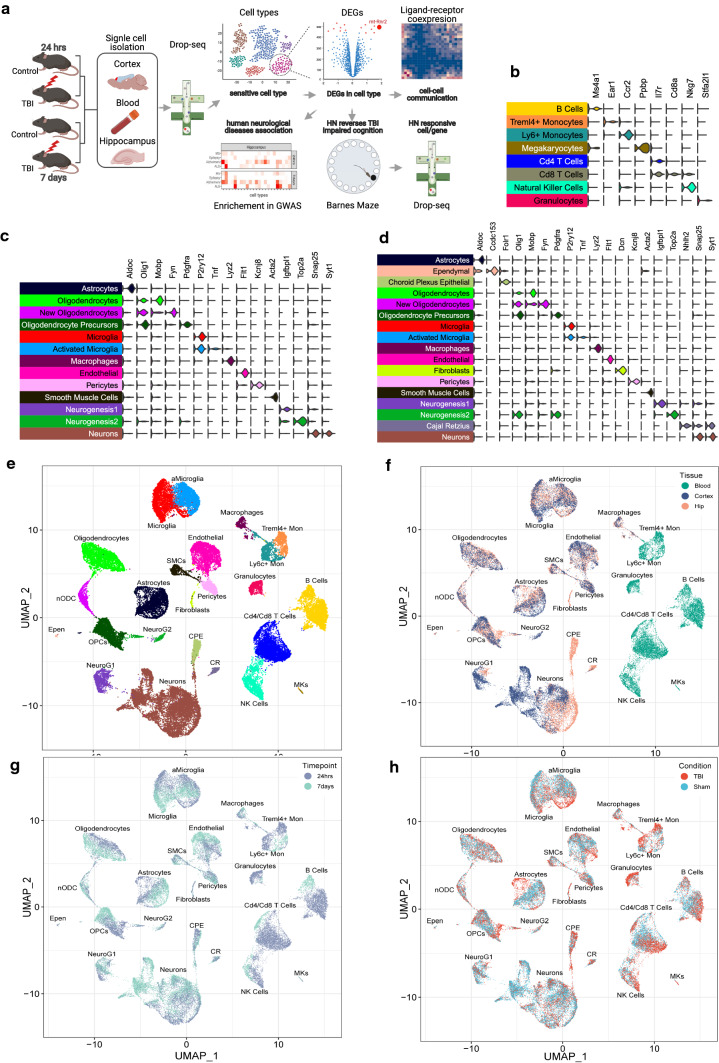
Fig. 1.
Overall study design and scRNAseq cell clusters and gene markers. a Overall study design. b–d Expression of cell markers for each cell type in peripheral blood (b), frontal cortex (c), and hippocampus (d). e–h UMAP embeddings of 78,895 cells according to cell types (e), tissues (f; frontal cortex, hippocampus, and peripheral blood), timepoints (g; 24-h vs 7-day), and conditions (h; TBI vs sham control). Each point represents a single cell. Cells are clustered based on transcriptome similarity using Louvain clustering and cell types are identified using canonical markers and labeled on the plot. Within each tissue and timepoint, there are n = 3 animals per group. HN: Humanin

