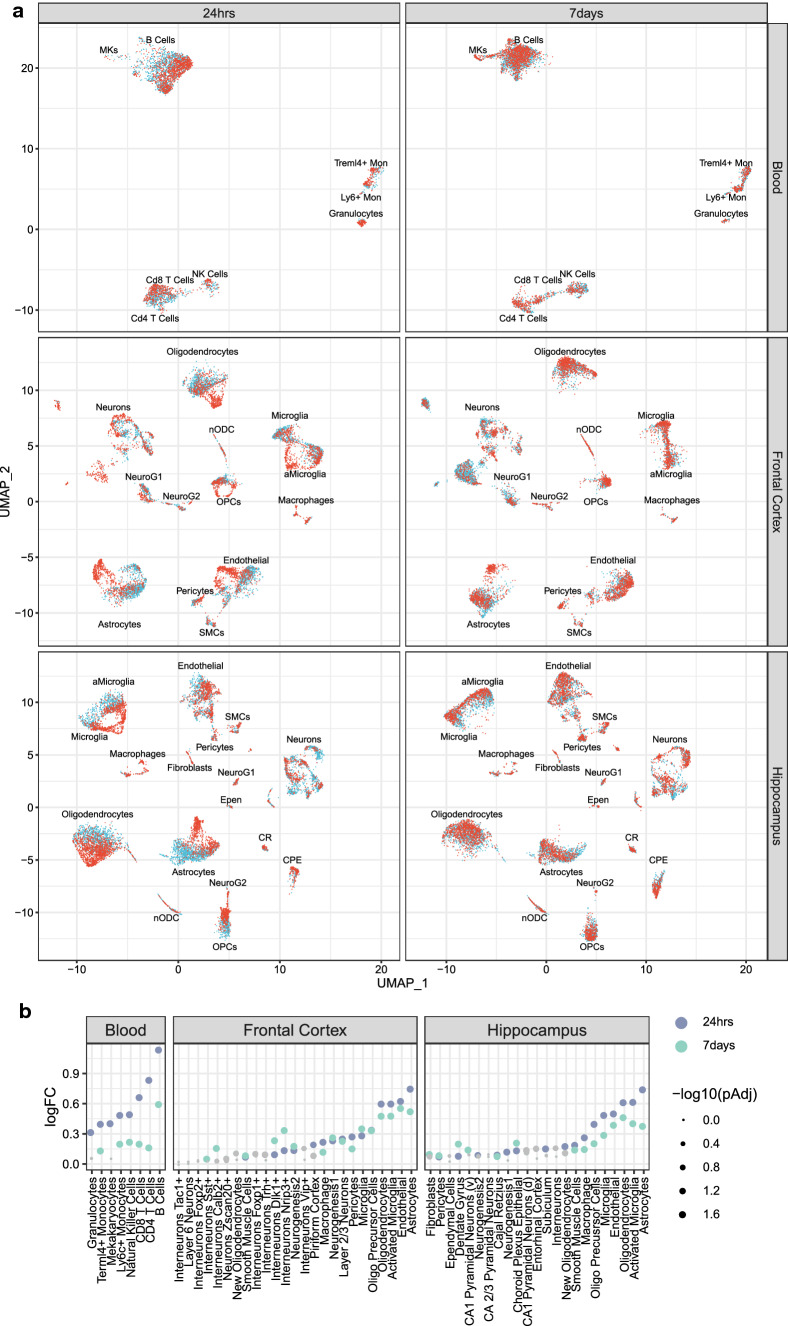
Fig. 2.
Transcriptomic shifts due to mTBI across cell types in the peripheral blood, frontal cortex, and hippocampus at 24-h and 7-day post-TBI. a Difference in the transcriptomes of cells in UMAP for each tissue, timepoint, and mTBI condition, with cells from TBI animals in red and cells from sham control animals in blue. b Euclidean distance between TBI and sham control cells within each cell type for each tissue and timepoint. The log fold change (logFC) between the empirical distance and null distribution for each cell type which quantifies the global transcriptome shift is indicated on the y-axis. Each point is colored by timepoint and the size of each point relates to the adjusted p-value. Gray points do not achieve statistical significance whereas colored dots reach adjusted p-value < 0.05

