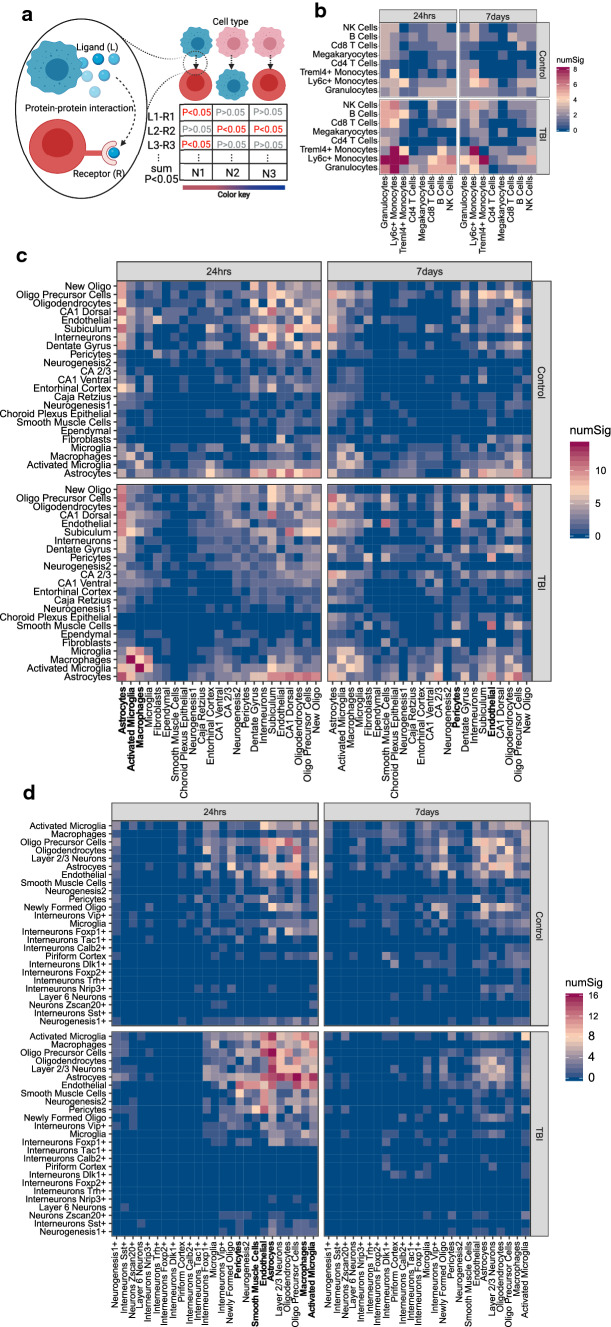
Fig. 3.
Alterations in ligand–receptor-mediated cell–cell communication in mTBI in individual tissues and timepoints. a Schematic diagram of CellPhoneDB which was applied to our single-cell data to infer significant ligand–receptor interactions between pairs of cells within the same tissue. Each plot is split into four panels which denote the timepoint (24-h or 7-day post-TBI) and the condition (sham control or TBI). The rows and columns indicate the interacting cell types determined by the number of ligand–receptor pairs between cell types. The color of each tile denotes the number of significant interactions between the two cell types under the assumption that cell types which are communicating more will have a larger number of ligand–receptor interactions. This method was applied to single-cell data from: b peripheral blood, c hippocampus, and d frontal cortex. The cell types mentioned in the main text were highlighted with red rectangles

