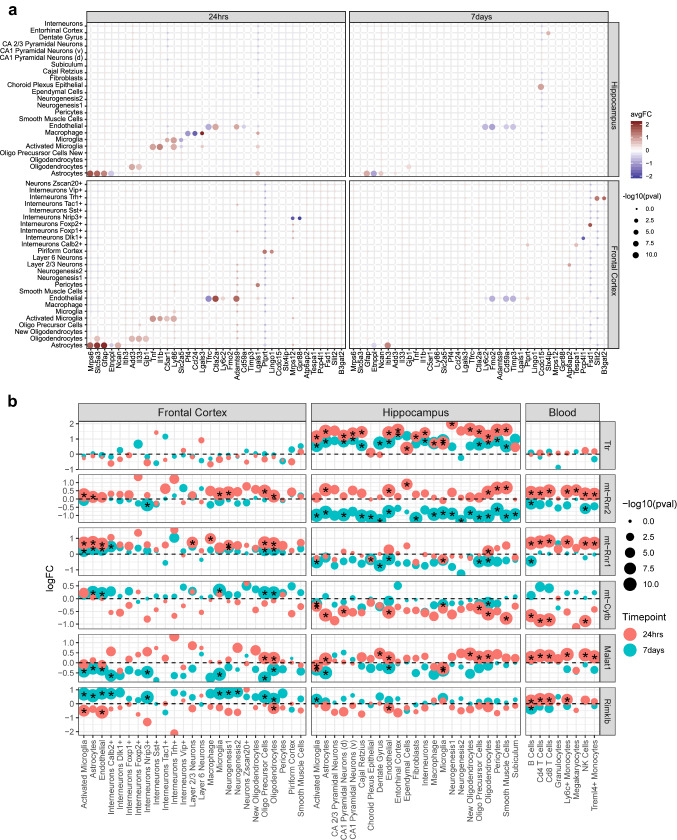
Fig. 5.
Top cell-type-specific and multi-cell-type DEGs. a The top DEGs which were significantly differentially expressed in a single cell type within a particular tissue and timepoint. Each DEG is depicted in a separate column and cell types are indicated by rows. The left panel is from 24-h post-TBI and the right panel is from 7-day post-TBI. The color of each dot indicates the log (fold change) of the bene between TBI and sham control cells (red indicates higher in TBI; cyan indicates lower in TBI) within a particular cell type. The size of each dot corresponds to the −log10(adjusted p-value). b The top DEGs significantly differentially expressed in the most cell types across tissues and timepoints. Each row depicts a DEG. The genes which are significantly differentially expressed (adjusted p-value < 0.05) in specific cell types are indicated by a star. The color of each dot indicates the timepoint (24-h in red and 7-day in blue) at which the DEG was found and the size of the dot corresponds to the −log10(p-value). The y-axis is the log(fold change) of the gene between TBI and sham control cells within a particular cell type. Cell types are indicated on the x-axis

