Fig. 6.
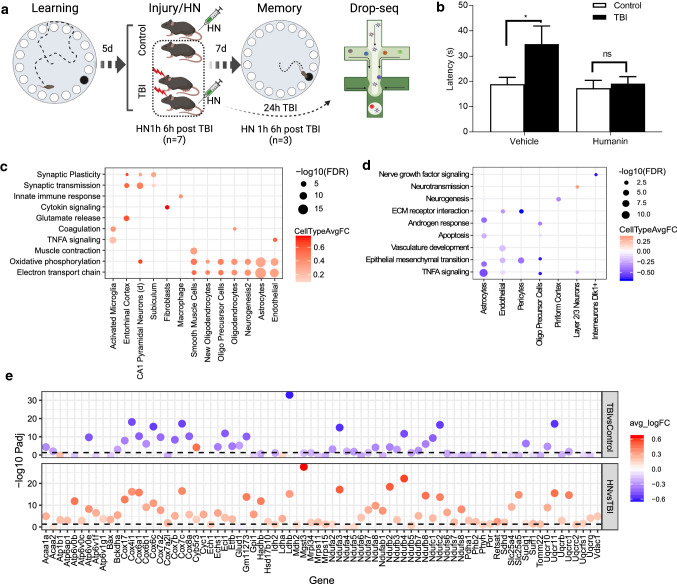
Experimental validation of humanin as a treatment target. a Schematic diagram of study design. b Bar plot of latency to navigate the maze for sham control and TBI mice treated with vehicle and humanin. Learning was conducted for 4 days prior to injury/surgery and memory was tested 7 days after injury/surgery. Statistics was computed using two-way ANOVA with Bonferroni correction for multiple comparison test. *p < 0.05, ns represents not significant, n = 6 per group. c, d Top enriched pathways of genes reversed by humanin treatment in hippocampus (c) and frontal cortex (d). Each point is colored by the average log(fold change) between cells from humanin-treated TBI animals and TBI cells within that cell type for significant DEGs which overlap the indicated pathway. The size of each dot corresponds to the −log10(FDR). Cell types and pathways have been clustered with hierarchical clustering. e Differentially expressed genes in the oxidative phosphorylation pathway in hippocampal astrocytes at 24-h post-TBI. Genes within the pathway are on the x-axis and −log10(adjusted p-value) of the differentially expressed gene on the y-axis. The color of each dot indicates the fold change between the groups; positive fold change is in red and negative fold change is in blue. The top panel shows differential expression for TBI versus sham control cells and the bottom panel shows differential expression for humanin-treated TBI cells versus TBI cells

