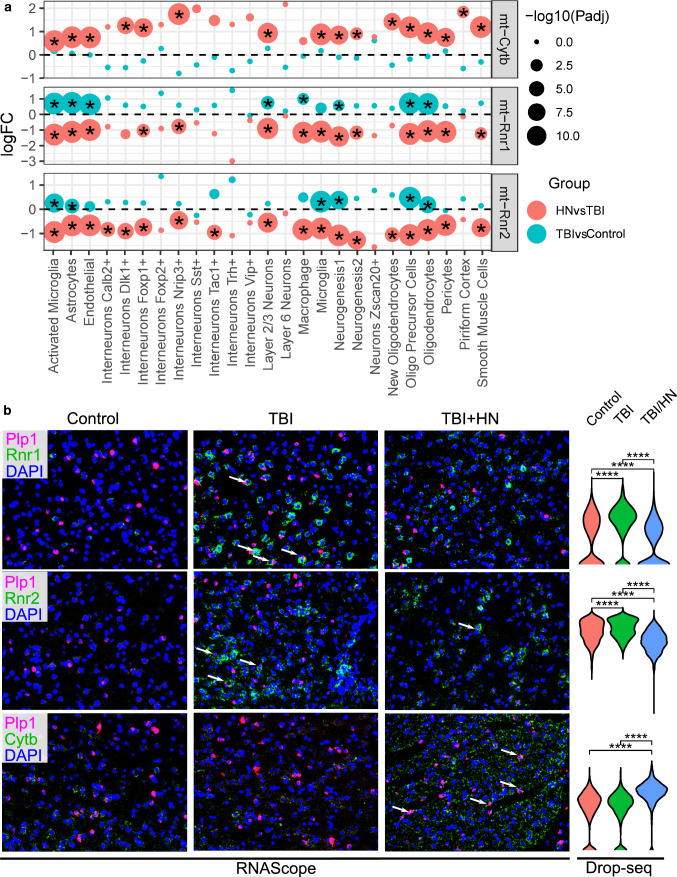
Fig. 7.
RNAscope validation of select DEGs affected by humanin identified from scRNAseq. a Gene expression of mt-Cytb, mt-Rnr1 and mt-Rnr2 across treatments in different cell populations of cortex with or without humanin (HN). The differentially expressed genes (adjusted p-value < 0.05) are indicated by a star. The color of each dot indicates the group which the DEG corresponds to and the size of the dot corresponds to the −log10(adjusted p-value). The y-axis is the log (fold change) of the gene between TBI and sham control or between TBI/Vehicle and TBI/HN cells within a particular cell type (indicated on the x-axis). b Validation of gene expression changes of mt-Cytb, mt-Rnr1 and mt-Rnr2 in response to TBI with or without HN in oligodendrocytes of cortex using RNAscope. Plp1 was used as oligodendrocytes marker and was stained in pink. The target DEGs mt-Cytb, mt-Rnr1 and mt-Rnr2 were stained in green. The arrows indicate the overlap between marker gene and target DEGs. The expression of each target DEG determined by scRNAseq is displayed as violin plots and Wilcoxon rank-sum test was used to determine statistical significance between sham control, TBI and TBI/HN groups and adjusted p-value was calculated. ****p < 1 × 10⁻⁴, ns: p > 0.05

