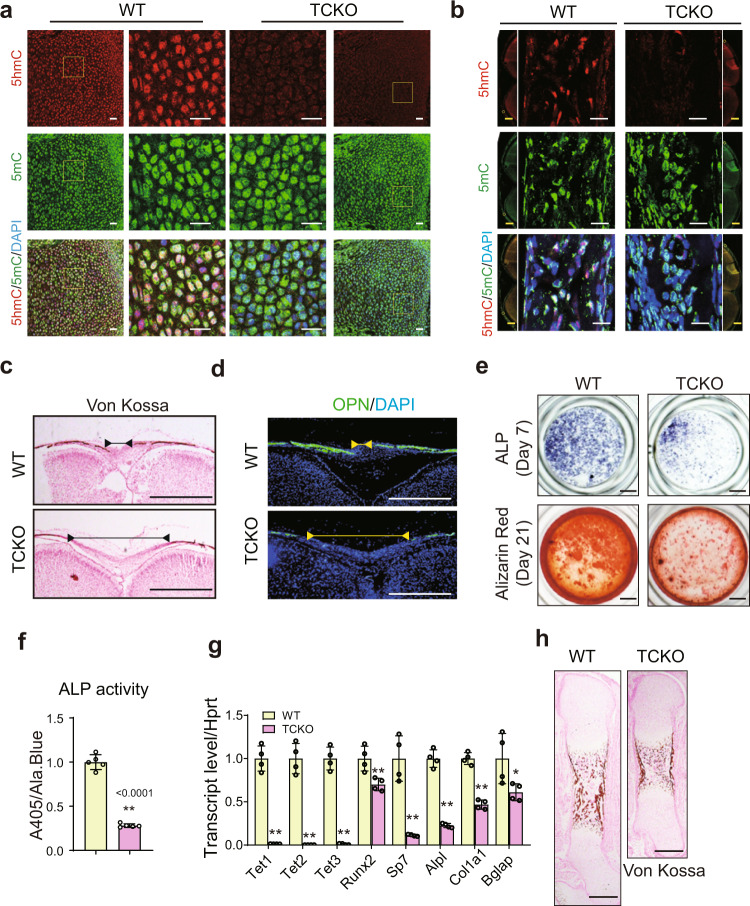
Fig. 2. Loss of Tet family genes impairs bone formation.
a, b Immunofluorescence assay of 5mC and 5hmC in limb at embryonic day 16.5 (E16.5) (a) and calvarial bone at P0 (b) of WT and TCKO mice. Scale bar = 20 μm or 500 μm. Representative images for three independent samples. The images in the center were zoomed in from the flanking images. c Representative images of Von-kossa staining in the cranial bones from WT and TCKO mice at P0. Scale bar = 500 μm. d Immunofluorescence of bone formation marker Osteopontin (OPN) in the cranial bones from WT and TCKO mice at P0. Scale bar = 500 μm. The lines with endpoint indicated the unmineralized region in the calvarial bone. Representative images for three independent samples. e ALP staining and Alizarin red S staining after osteoblast differentiation for 7 days (top) and 21 days (bottom), respectively. Scale bar = 1 mm. Representative images for five independent samples. f ALP activity quantification was measured by phosphatase substrate assay as A405/Ala.Blue. **P < 0.01. Two-tailed Student’s t test. Data are presented as mean ± s.d., n = 5 independent cell supernatants. g RT-qPCR analysis of Tet1, Tet2, Tet3, Runx2, Sp7, Alpl, Col1α1, and Bglap expression after osteoblast differentiation for 7 days, cells were from WT and TCKO mice. *P < 0.05, **P <0.01. Two-tailed Student’s t test. Data are presented as mean ± s.d., n = 4 independent samples. h Representative images of Von-kossa staining in the femurs of WT and TCKO mice at E16.5. Scale bar = 500 μm.

