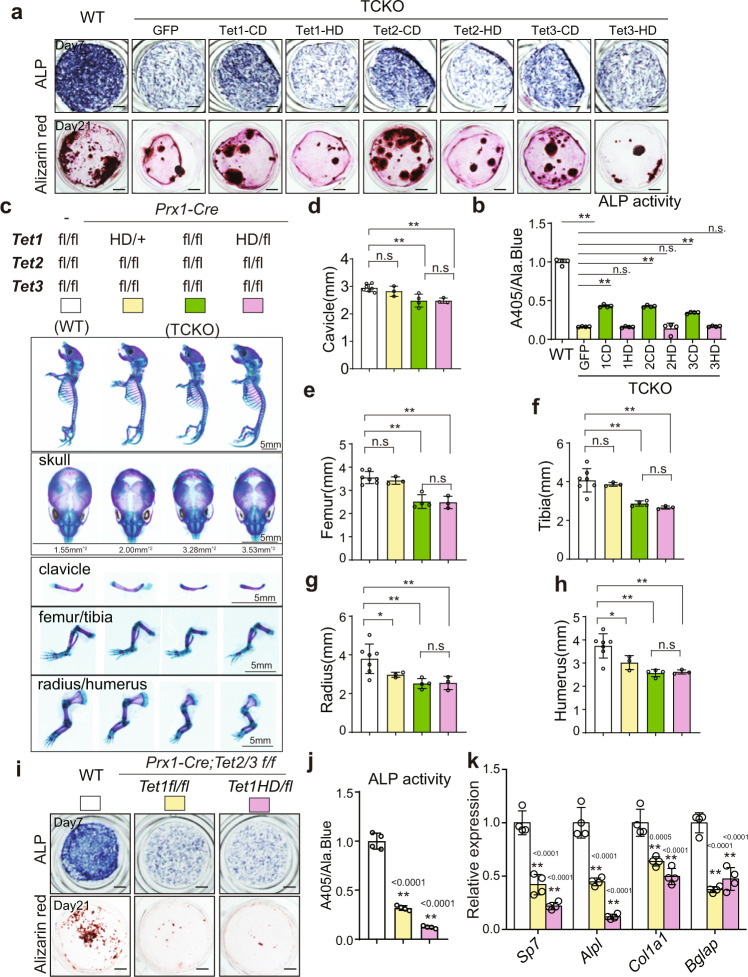
Fig. 3. Tet-mediated bone formation is dependent on its catalytic domain.
a ALP staining and Alizarin red S staining after osteoblast differentiation for 7 days (up) and 21 days (bottom), respectively. Cells were isolated from calvarial bones of WT and TCKO mice, and cells from TCKO mice were infected with indicated lentivirus. Scale bar = 1 mm. b ALP activity quantification was measured by phosphatase substrate assay as A405/Ala. Blue. *P < 0.05, **P < 0.01. Ordinary one-way ANOVA. Data are presented as mean ± s.d., n = 4 independent cell supernatants. c The whole mount skeleton staining of WT and indicated genotype mice by Alcian blue and Alizarin red S at P0. Scale bar = 5 mm. d–h Quantification of the length of clavicle (d), femur (e), tibia (f), radius (g), and humerus (h) of indicated genotype mice. *P < 0.05, **P < 0.01. Two-tailed Student’s t test. Data are presented as mean ± s.d., WT mice = 7, Prx1-Cre; Tet1 HD/+ Tet2 f/f Tet3 f/f mice = 3, Prx1-Cre; Tet1 f/f Tet2 f/f Tet3 f/f mice = 4, Prx1-Cre; Tet1 HD/f Tet2 f/f Tet3 f/f mice = 3 biologically independent animals. i ALP staining and Alizarin red S staining after osteoblast differentiation for 7 days (up) and 21 days (bottom), respectively. Scale bar = 1 mm. j ALP activity quantification was measured with by phosphatase substrate assay as A405/Ala. Blue. *P < 0.05, **P < 0.01. Ordinary one-way ANOVA. Data are presented as mean ± s.d., n = 4 independent cell supernatants. k RT-qPCR analysis of Sp7, Alpl, Col1α1, and Bglap expression after osteoblast differentiation for 7 days, cells were from indicated genotype mice. *P < 0.05, **P < 0.01. Ordinary one-way ANOVA. Data are presented as mean ± s.d., n = 4 independent samples.

