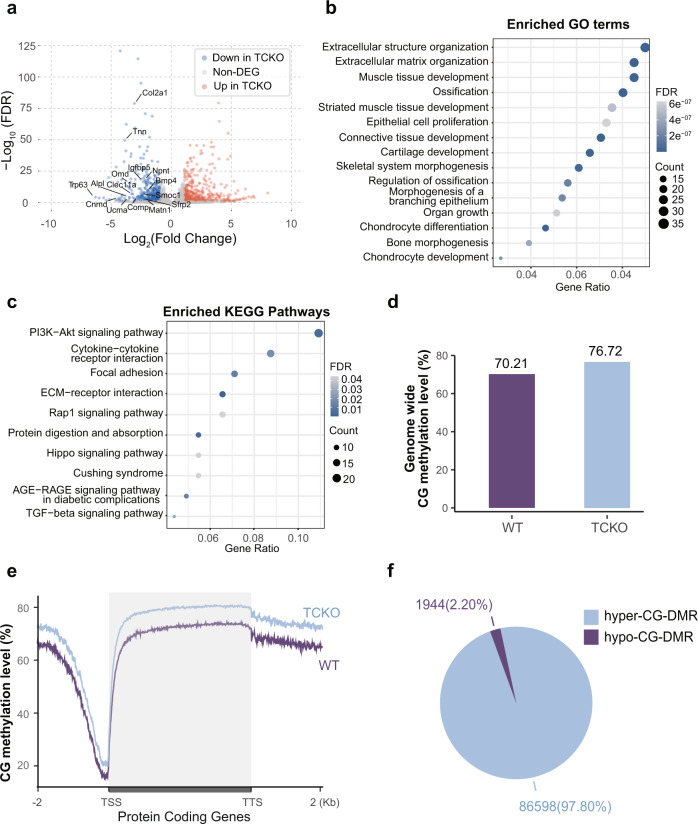
Fig. 4. Genome-wide differentially gene expression and DNA methylation patterns between TCKO and WT cells.
a Volcano plot of differential expressed protein-coding genes (Fold Change greater than 2 and FDR less than 0.05). b, c Enriched GO term (b) and KEGG pathway (c) analysis of downregulated genes in TCKO cells. d Barplot of genome-wide CG methylation level in TCKO and WT cells. e Metaplot of CG methylation level over protein-coding genes in TCKO and WT cells. f Pie chart of hypermethylated and hypomethylated CG-DMR counts in TCKO and WT cells. TSS transcription start site, TTS transcription termination site.

