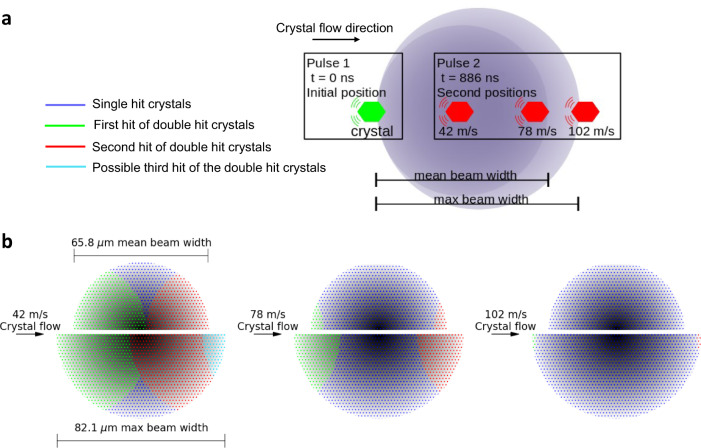
Fig. 2. Model for how multi-hits occur for a single crystal.
a Schematic diagram (not to scale) illustrating the minimum distances travelled by an 8 µm crystal for the three different jet speeds overlaid with the average beam Full Width (FW, dark purple shaded region) and the maximum beam FW (light purple shaded region). The green crystal depicts the initial position, and the red crystal illustrates how far the crystal travels after the first hit for 42 m/s, 78 m/s, and 102 m/s jet speeds. b Schematic representation of the crystal path through the X-ray beam for each of the three jet speeds for the mean beam FW (upper half) and maximum beam FW (lower half) as indicated on the first image. The mean FW is consistent for all jet speeds. The beam profile (shaded grey) is overlaid with the regions that the crystal travels through for the single hits (blue) to occur as well as the first (green) and second (red) hits of the double hit crystal. For the 42 m/s jet speed it also shows a possibility of the crystals being hit a third time (aqua) if the crystal and beam conditions were optimal. Note, for 42 m/s and 78 m/s, regions where no hits occur are possible.

