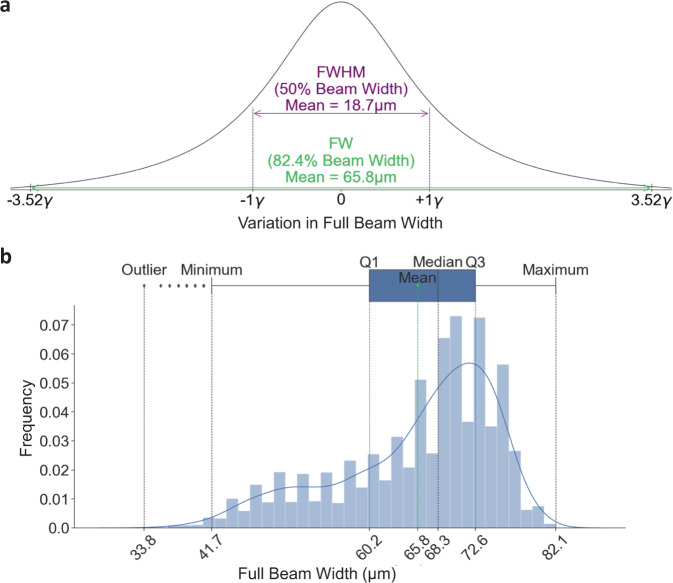
Fig. 3. Characteristic beam profile.
a A histogram showing the X-ray beam profile. The beam profile was modelled using a Lorentzian distribution with a Full Width Half Maximum (FWHM) = 2γ (50% of beam) and Full Width (FW) = 7.04γ (82.4% of beam). b The Lorentzian distribution used to determine the FWHM and FW from 6773 YAG images. The furthermost outlier, minimum, Q1 (25th percentile), mean, median, Q3 (75th percentile), and maximum have been indicated. To obtain the FWHM and FW for each YAG image, a 7.5% noise threshold was applied to the image combined with a 3 × 3 median filter to account for the noise.

