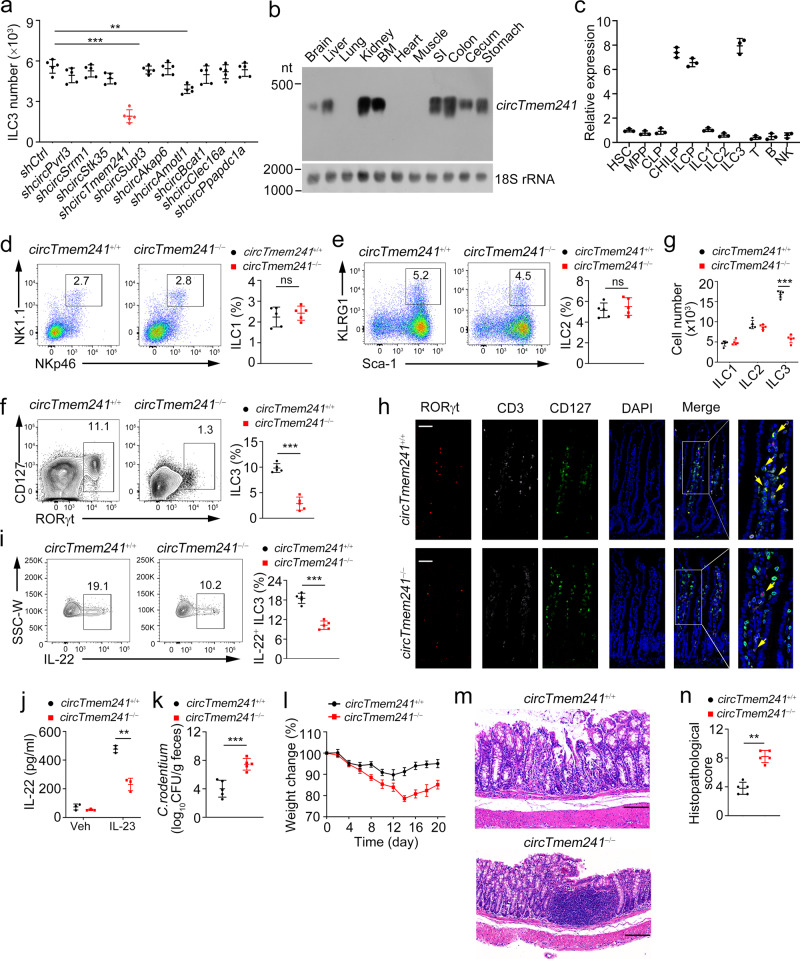
Fig. 1. CircTmem241 knockout decreases ILC3 numbers.
a Top 10 highly expressed circRNAs were knocked down in CHILPs, followed by in vitro differentiation assay. ILC3s (CD3−CD19−CD127+CD45lo RORγt+) were analyzed by FACS. n = 5 for each group. b CircTmem241 expression levels of indicated tissues were detected by Northern blot using biotin-labeled probes. 18 S RNA was used as a loading control. c Relative expression of circTmem241 was measured in indicated hematopoietic progenitors and mature cells by qPCR. Fold changes were normalized to endogenous 18 S. HSC (Lin−c-Kit+Sca-1+CD150+CD48−), MPP (Lin−c-Kit+Sca-1+CD150−CD48+), CLPs (Lin−CD127+c-KitintSca-1intFlt3+α4β7−), CHILPs (Lin−CD25−CD127+Flt3−α4β7+Id2GFP) and ILCPs (Lin−CD127+Flt3−c-Kit+α4β7+PLZFGFP) were isolated from BM cells. ILC1s (CD3−CD19−CD45+CD127+NK1.1+NKp46+), ILC2s (Lin−CD127+CD90+KLRG1+Sca1+) and ILC3s (CD3−CD19−CD127+CD45lo CD90hi) were isolated from small intestinal lamina propria. T cells (CD3+CD45+) were isolated from thymus. B cells (NK1.1−CD19+CD45+) and NK cells (NK1.1+CD19−CD45+) were isolated from spleen. n = 3 biological independent experiments. d–f ILC1s (CD3−CD19−CD45+CD127+ gated), ILC2s (CD3−CD19−CD127+CD90+ gated), and ILC3s (CD3−CD19−CD45low gated) were analyzed in small intestines of circTmem241+/+ and circTmem241−/− mice by FACS. n = 5 for each group. g Numbers of indicated ILCs in d–f were calculated. n = 5 for each group. h Immunofluorescence staining of ILC3s in small intestines from circTmem241+/+ and circTmem241−/− mice. Yellow arrows indicate ILC3s. Scale bar, 100 μm. i Lamina propria lymphocytes (LPLs) from circTmem241+/+ and circTmem241−/− mouse intestines were sorted and stimulated by IL-23 for 4 h, followed by IL-22+ ILC3 detection with FACS. n = 5 for each group. j IL-22 levels secreted by ILC3s from circTmem241+/+ and circTmem241−/− intestines were assayed by ELISA after stimulation by IL-23 for 24 h. n = 3 for each group. k Body weight changes of circTmem241+/+ and circTmem241−/− mice were analyzed after C. rodentium infection. n = 5 for each group. l Bacterial counts (CFUs) in feces of circTmem241+/+ and circTmem241−/− mice were measured after infection with C. rodentium for 6 days. n = 5 for each group. m Colon tissues from circTmem241+/+ and circTmem241−/− mice were analyzed by H&E staining. Scale bars, 100 μm. n Histopathological scores of colons from circTmem241+/+ and circTmem241−/− mice over C. rodentium infection. n = 5 for each group. **P < 0.01 and ***P < 0.001. Data were analyzed by an unpaired two-side Student’s t test and shown as means ± SD. Data are representative of at least three independent experiments. Source data are provided as a Source Data file.

