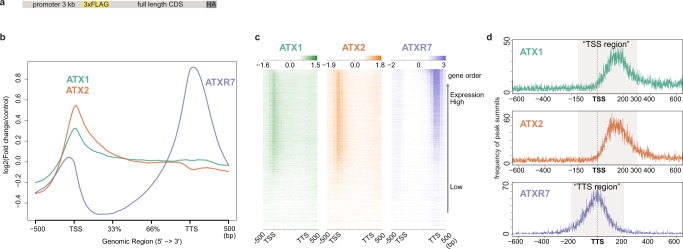
Fig. 2. ATX1 and ATX2 occupy TSS while ATXR7 occupies TTS.
a The transgene structure of tagged ATX(R) proteins used for ChIP-seq. b, c Metaplot (b) and heat maps (c) illustrating ATX1, ATX2, and ATXR7 distributions in the gene body region corrected with a non-transgenic control. The heat map was sorted so that highly transcribed genes (measured as mRNA-seq in WT) come to the top. d Position of ATX1 and ATX2 ChIP-seq peak summits relative to TSS and ATXR7 peaks relative to TTS (x-axis), visualized as a frequency of peak summits (y-axis), which are detected against non-transgenic control using MACS2 peak caller. The numbers of peaks are summarized in Supplementary Data 3. Most of the ATX1 and ATX2 peaks belong to the region spanning from 150 bp upstream to 300 bp downstream of TSS (hereafter ‘TSS region’). Most of the ATXR7 peaks are between 200 bp upstream and 200 bp downstream of TTS (hereafter ‘TTS region’).

