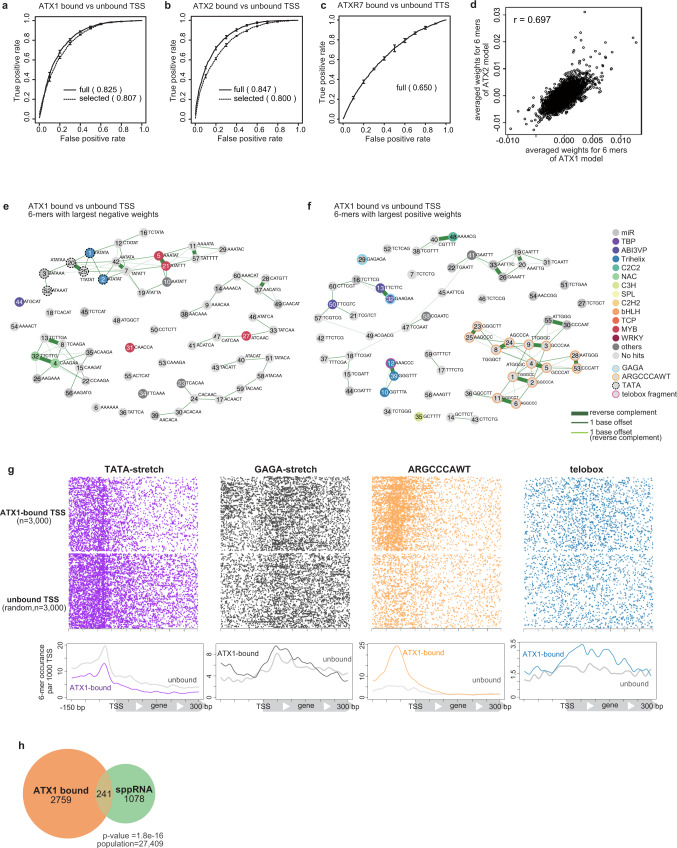
Fig. 4. The DNA sequences of ATX1- and ATX2-bound TSSs have distinct architectures.
a–c ROC plots that show predicting accuracy of linear SVM models, which are trained with the full set of 6- mers (solid line) and trained with the 120 6-mers which were highly weighted in the full model (dashed line), to discriminate (a) ATX1- or (b) ATX2-bound vs -unbound TSS DNA sequence, and (c) ATXR7-bound and-unbound TTS sequence. ROC and AUC are calculated with data on Chr 5, which are held out from the training as test data. Averaged scores of 5 cross-fold validation models are plotted. Error bars represent the standard deviation of the 5 repeats of training. Analyses with ChIP-seq datasets of biological replicates (see Methods) showed similar results (Supplementary Fig. 9). d Averaged SVM weights from ATX1 models (x-axis) correlates with those from ATX2 models (y-axis), indicating that similar sets of sequences predict ATX1 and ATX2 localizations. r = Pearson’s correlation coefficient. e, f Clustering and annotation of predictive 6-mers. Each circle represents the top sixty 6-mers with negative (e) or positive (f) averaged SVM weights in the ATX1 models. Numbers within the circle are ranks of weights’ absolute values (the more ‘predictive’ a 6-mer is, the smaller the number labels it). Pairs of related 6-mers are connected with lines; the thickest lines connect reverse complement pairs, the thinner lines connect neighboring 6-mers with 1 base offset, the thinnest lines connect reverse complement pairs with 1 base offset. Each 6-mers was searched for matching motifs (see Methods), then 6-mer circles were colored corresponding to the category of its top matched motif that meets q-value <0.1 criteria. 6-mers corresponding to ARGCCCAWT, telobox, GAGA, and TATA-stretch are manually highlighted with border circles. Some of the highly weighted motifs are evolutionarily conserved among TSS regions of the land plants, suggesting their functionality (Supplementary Fig. 13). g Positional distributions of the highly weighted motifs in the TSS region. h ATX1-bound TSS significantly overlaps with sppRNA-harboring TSS detected in the hen2-2 background. The significance of the overlap was tested using a hypergeometric test.

