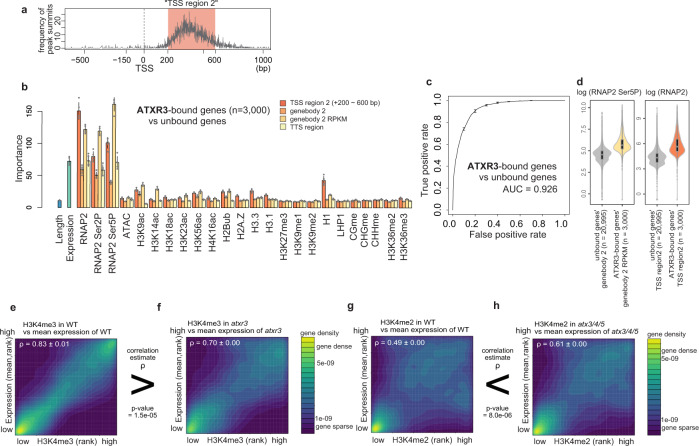
Fig. 6. Localization and functional mode of other Arabidopsis H3K4 methyltransferases.
a Position of ATXR3 peaks relative to TSS, visualized as a frequency of ChIP-seq peak summits around TSS. x-axis, distance from TSS; y-axis, number of peak summits. Most of the ATXR3 peaks belong to the region spanning from 200 bp to 600 bp downstream of TSS, which we hereafter refer to as ‘TSS region 2’. b Chromatin features predictive of ATXR3 localization. Error bars represent the standard deviation of the 5 repeats of training. c ROC plot showing the prediction accuracy of the random forest models. AUC indicates the area under the ROC curve. ROC and AUC are calculated with data on Chr 5, which are held out from the training as test data. Average and standard deviation of the 5 repeats of training are plotted. d Violin plots showing the abundance of the two most predictively ‘important’ features. The center line of violin plot, median; box limits, upper and lower quartiles; whiskers, 1.5× interquartile range. e–h Protein-coding genes are ranked in order of H3K4me3 (e, f) or H3K4me2 (g, h) (x-axis, RPM) and expression levels (y-axis, mRNA-seq FPKM, mean of the three RNA-seq replicates). The densities of genes are visualized as heat maps. ρ is the Spearman’s correlation coefficient. Three replicates of mRNA-seq resulted in three ρ for each genotype, and the average and standard deviation of ρ are represented. ChIP-seq data used is the data sets shown in Fig. 1d. P values indicate that correlation estimates ρ significantly differ between genotypes (Welch’s two sample t-test).

