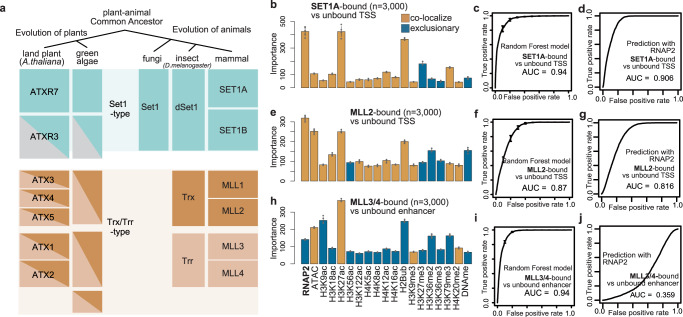
Fig. 7. Localization and functional mode of mammalian H3K4 methyltransferases.
a Evolution of H3K4 methyltransferases in eukaryotes based on18,43. b, e, h Chromatin features predictive of the localizations of SET1A (b) and MLL2 (e) at the TSS regions, and MLL3/4 (h) at the enhancer regions. Bars are colored brown if the mean abundance of the feature is bound region > unbound region (i.e. colocalize), and colored blue otherwise (i.e. exclusive). Error bars are the standard deviation of the 5 repeats of training. c, f, i ROC plot showing the prediction accuracy of the random forest models corresponding to (b, e, h). d, g, j ROC plot showing the prediction accuracy using levels of RNAP2 as the sole predictor. All ROC and AUC are calculated with test data (25% of the original data). Error bars represent the standard deviation of the 5 repeats of training. All the genomic data used here are curated from previous works (Supplementary Data 7).

