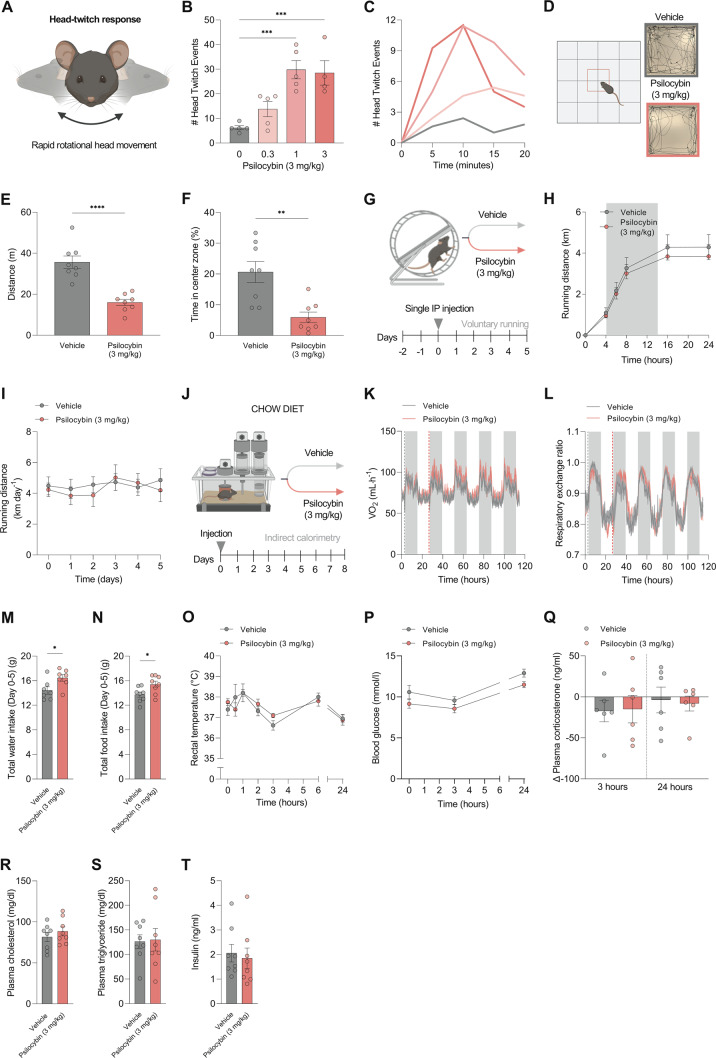
Fig. 1. A single high dose of psilocybin does not have an effect on basal physiology in chow-fed mice.
A Schematic overview of the head-twitch response study (characterized by a rapid side-to-side head movement), was used to inform the dose for further experiments. B Total number of head-twitches at each dose. C Time course of head-twitch events. D Schematic of open field test (OFT), and representative traces for a vehicle-treated and psilocybin-treated (3 mg/kg) mouse. E Distance traveled in the assessment of exploratory behavior in the OFT, 30 min after administration with psilocybin (3 mg/kg) or vehicle (n = 8 per group). F Percentage of time spent in the center zone. G Schematic overview of voluntary wheel running experiment. H Effect of a single high dose of psilocybin on voluntary wheel behavior (24 h), (n = 7–8 per group). I Running distance in the five days following injection with psilocybin (3 mg/kg; n = 8) or vehicle (n = 7). J Schematic of indirect calorimetry study of mice treated with psilocybin (3 mg/kg) or vehicle (n = 8 per group). K VO2. Red dashed line indicates the day of injection. L Respiratory exchange ratio. Red dashed line indicates day of injection. M Water intake (cumulative) after five days in metabolic cages. N Cumulative food intake after 5 days in metabolic cages. O Rectal temperature 0, 15, 30 min, 1, 3, 6, and 24 h after administration of psilocybin (3 mg/kg) or saline (n = 8 per group). P Blood glucose at 0 min, 3, and 24 h following administration of psilocybin (3 mg/kg) or vehicle (n = 8 per group). Q Change in plasma corticosterone 3 and 24 h following administration of psilocybin (3 mg/kg) or vehicle (n = 6 per group). R Total plasma cholesterol 24 h after administration of psilocybin (3 mg/kg) or vehicle (n = 8 per group). S Plasma triglycerides 24 h after administration of psilocybin (3 mg/kg) or vehicle (n = 8 per group). T Plasma insulin 24 h after administration of 3 mg/kg or vehicle (n = 8 per group). Data analyzed by one-way ANOVA with Dunnett’s test (B), unpaired two-tailed t-test (E, F, M, N, Q, R, S, T), repeated measures two-way ANOVA with Bonferroni’s multiple comparison test (H, O, P). Mixed effects analysis with Bonferroni’s multiple comparison test (I; missing values as one mouse failed to run on two occasions). Data are presented as mean ± SEM. *P < 0.05, **P < 0.01, ***P < 0.001, ****P < 0.0001.

