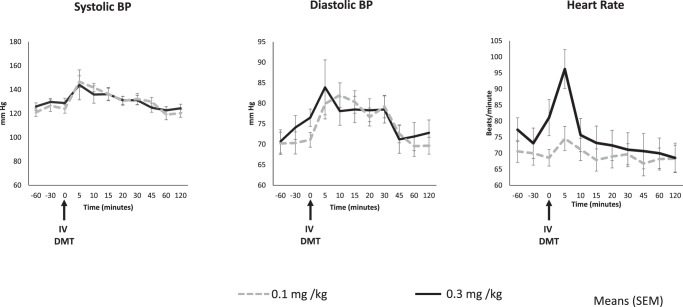
Fig. 1. Blood pressure and heart rate.
Figure shows changes in means (error bars indicate standard error of mean) of systolic and diastolic blood pressure (mm Hg), and heart rate (beats/min) over time on the 0.1 and 0.3 mg/kg DMT. Arrow indicates the time at which DMT was administered. n = 10 for 0.1 mg/kg (n = 3 healthy, n = 7 depressed) and n = 9 for 0.3 mg/kg (n = 3 healthy, n = 6 depressed).

