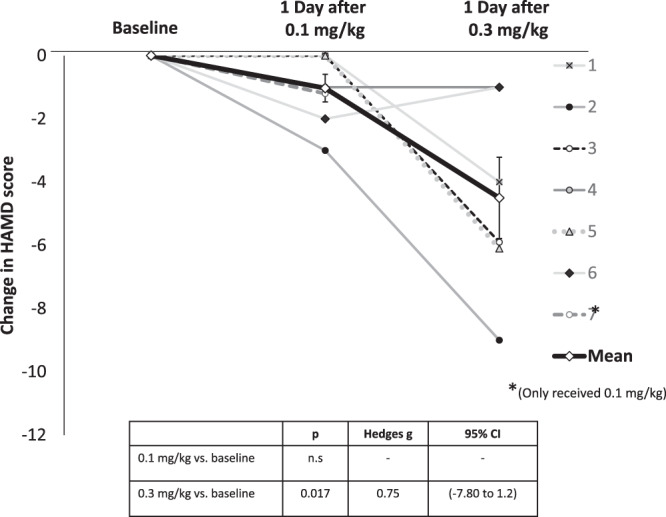
Fig. 2. Change in depression.

Figure shows changes in HamD-17 total scores of individual participants the day after 0.1 and 0.3 mg/kg DMT relative to baseline. Each subject is represented by a line in a different color. The group mean is shown in black. *Note that subject 7 completed the 0.1 mg/kg dosing session before being withdrawn for administrative reasons.
