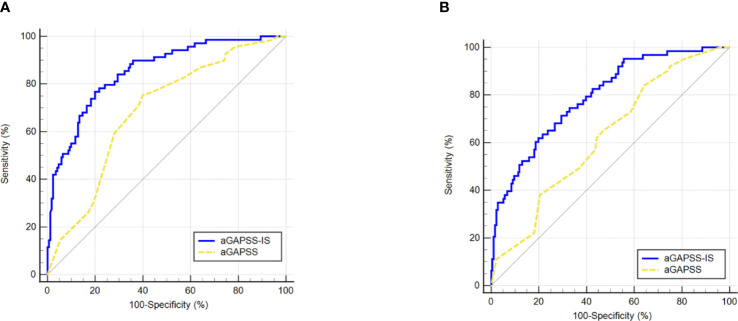
Figure 3.
Comparison of the area under the receiver operating characteristic curve values between aGAPSS-IS score and aGAPSS in the training and the validation cohort. (A) In the training cohort, the aGAPSS-IS score had a larger AUROC than the aGAPSS [0.853 (95% CI, 0.802-0.896) vs. 0.686 (95% CI, 0.623-0.744), P < 0.001]; (B) In the validation cohort, the AUROC of aGAPSS-IS score was larger than the aGAPSS [0.793 (95% CI, 0.737-0.843) vs. 0.624 (95% CI, 0.560-0.656), P < 0.001]. aGAPSS, adjusted Global Anti-Phospholipid Syndrome Score.

