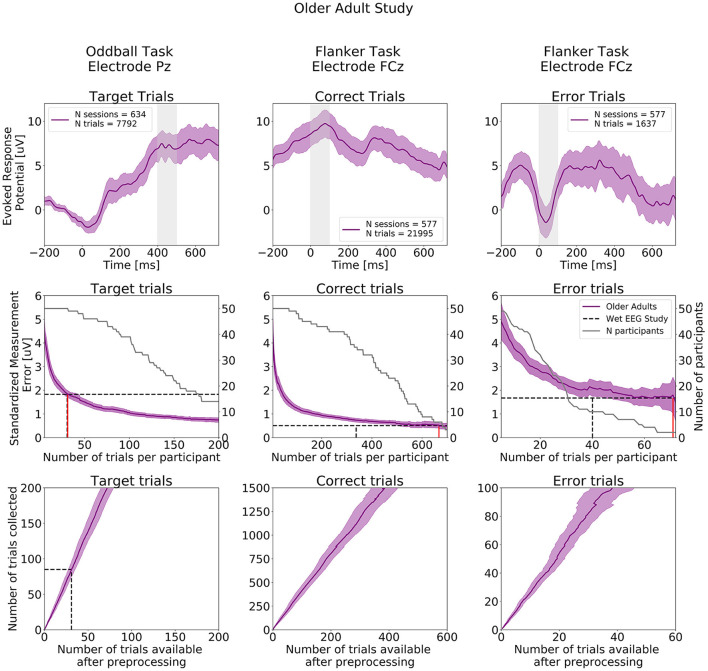
Figure 9.
ERPs analyses extracted from the Older Adult Study (N = 50). Top row: Grand study average computed across all participants. Middle row: Standardized Measurement Errors per number of trials. The gray continuous lines correspond to the number of participants remaining in the SME calculation after trial rejection. Bottom Row: Mean numbers of trials available after preprocessing. The black dotted lines correspond to the mean numbers of trials extracted from the wet EEG study. From left to right: Target Trials extracted from the Oddball task at electrode Pz, Correct Trials extracted from the Flanker task at electrode FCz, Error Trials extracted from the Flanker task at electrode FCz. The shaded areas correspond to the 95% confidence intervals.

