
Figure 4.
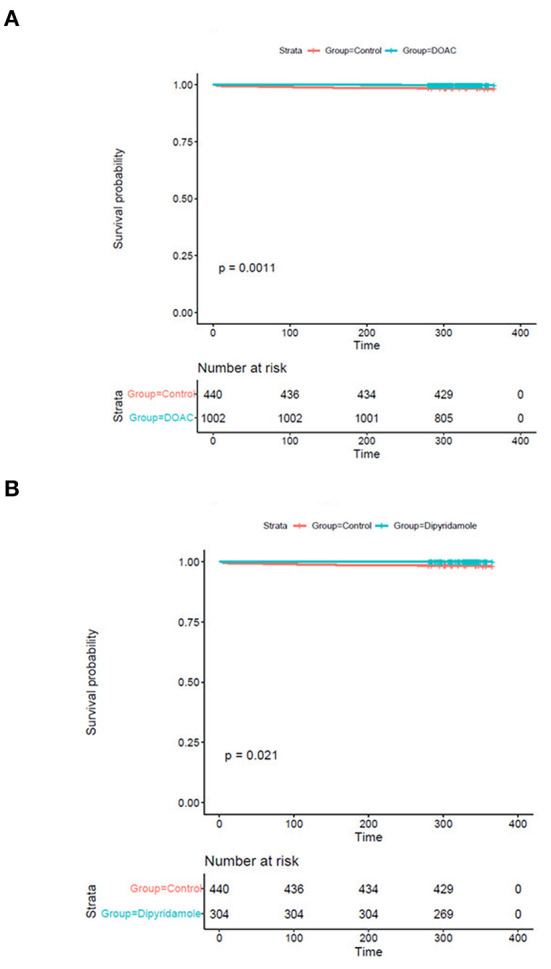
Kaplan-Meier plots of cardiovascular survival probability (A) cardiovascular mortality rates of controls vs. patients treated with DOAC, (B) cardiovascular mortality rates of controls vs. patients treated with dipyridamole.
Official websites use .gov
A
.gov website belongs to an official
government organization in the United States.
Secure .gov websites use HTTPS
A lock (
) or https:// means you've safely
connected to the .gov website. Share sensitive
information only on official, secure websites.
Kaplan-Meier plots of cardiovascular survival probability (A) cardiovascular mortality rates of controls vs. patients treated with DOAC, (B) cardiovascular mortality rates of controls vs. patients treated with dipyridamole.