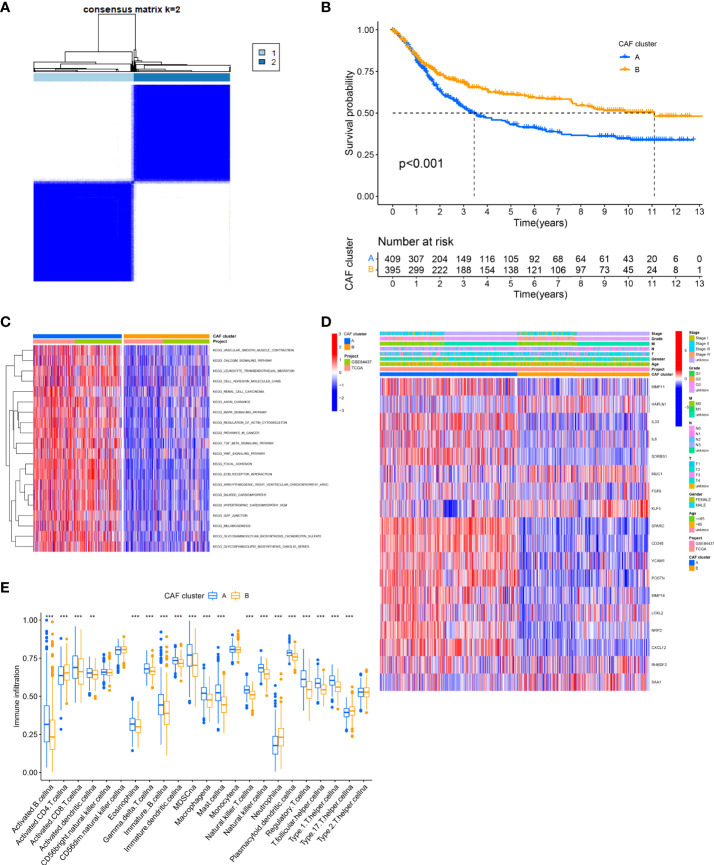
Figure 2.
Identification of CAFs subtypes in GC. (A) Consensus matrix heatmap defining two clusters (k = 2) and their correlation area. (B) Univariate analysis indicating 18 CAFs-related genes corelated with the OS time. (C) GSVA of biological pathways between two distinct subtypes. (Red and blue represent activated and inhibited pathways, respectively). (D) Differences in clinicopathologic features and expression levels of CAFs-related genes between the two distinct subtypes. (E) The 22 infiltrating immune cell types in the two GC subtypes. **P<0.01, ***P<0.001.

