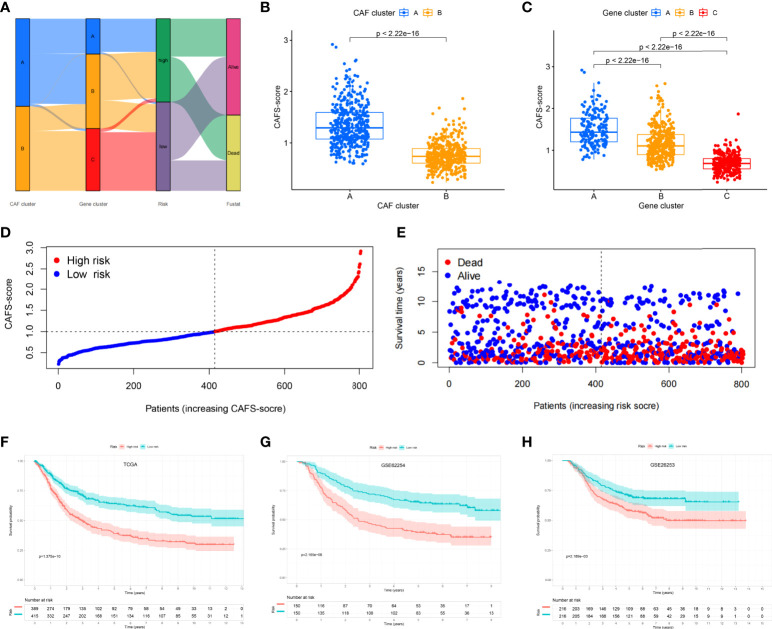
Figure 4.
Establishment risk assessment model and survival outcomes in GC. (A) Alluvial diagram of the subtype distributions in groups with different CAFS-score and survival outcomes. (B) Differences in CAFS-score between two CAF subtypes. (C) Differences in CAFS-score between three gene subtypes. (D, E) Ranked dot and scatter plots representing the CAFS-score distribution and patient survival status. (F-H) Kaplan-Meier analysis of the RFS between the two risk groups in the TCGA, GSE62254, and GSE26253 cohort.

