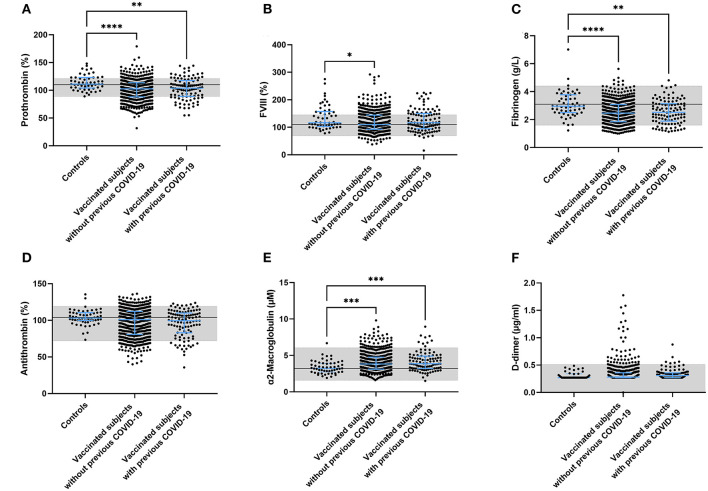
Figure 2.
Coagulation factor levels in controls and subjects vaccinated with ChAdOx1-S with and without prior COVID-19 infection. Plasma levels of prothrombin (A), FVIII (B), fibrinogen (C), antithrombin (D), α2-macroglobulin (E) and D-dimer (F) were quantified. Reference values for each test are indicated as the gray area in the dot plot. Differences between the groups were analyzed by ANOVA or Kruskal-Wallis analysis, depending on the distribution of the data. P-values below 0.05, 0.01, 0.001, and 0.0001 were marked as *, **, ***, and ****, respectively.

