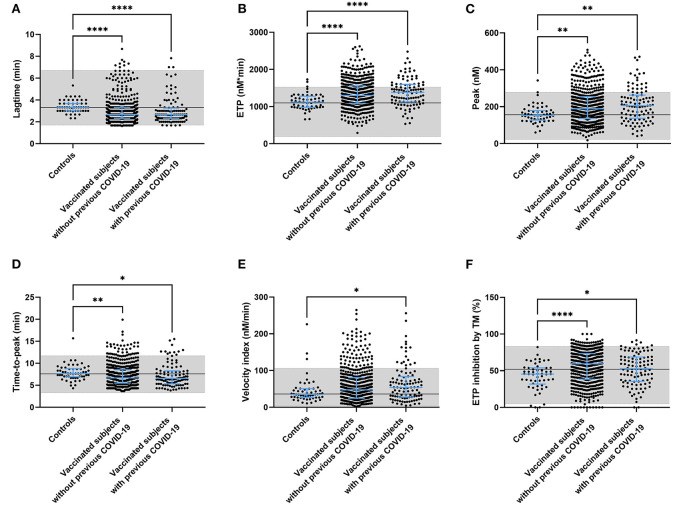
Figure 3.
Thrombin generation parameters in controls and subjects vaccinated with ChAdOx1-S with and without prior COVID-19 infection. Thrombin generation was measured at 5 pM tissue factor and the lag time (A), ETP (B), peak height (C), time-to-peak (D), velocity index (E), and the inhibition of the ETP by the addition of thrombomodulin (F) were quantified. Reference values for each parameter are indicated as the gray area in the dot plot. Differences between the groups were analyzed by ANOVA or Kruskal-Wallis analysis, depending on the distribution of the data. P-values below 0.05, 0.01, 0.001, and 0.0001 were marked as *, **, ***, and ****, respectively.

