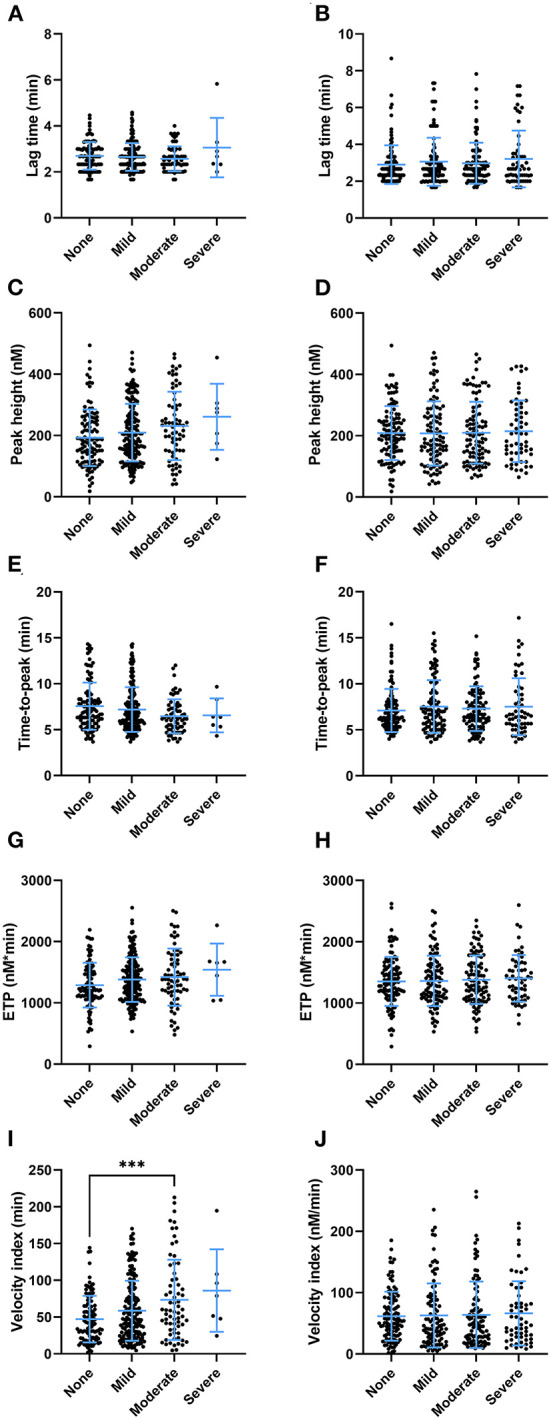
Figure 6.

The association of thrombin generation parameters and clinical symptoms after the second round of vaccination as reported by subjects vaccinated with ChAdOx1-S with and without prior COVID-19 infection. (A,B) The lag time did not differ significantly at the increasing levels of injection site symptoms (A) or systemic symptoms (B). The peak height differed significantly between subjects with increasing injection site symptoms (p < 0.038), although the study was underpowered to detect differences between specific groups in post hoc analysis (C). Increasing systemic symptoms did not result in differences in peak height (D). (E,F) The time-to-peak differed significantly between the categories of injection site symptoms (p = 0.029) (E), but not systemic symptoms (F). (G,H) The ETP was not significantly affected by the various levels of injection site symptoms (G) or systemic symptoms (H). (I) The velocity index was significantly increased in subjects with more injection site symptoms (p < 0.001) (I), but not systemic symptoms (J). Data are displayed as mean and standard deviation or as percentages in the case of categorical variables. Differences between the groups were analyzed by ANOVA or Kruskal-Wallis analysis, depending on the distribution of the data. A p-value below 0.05 was considered statistically significant and *** indicates a p-value below 0.001.
