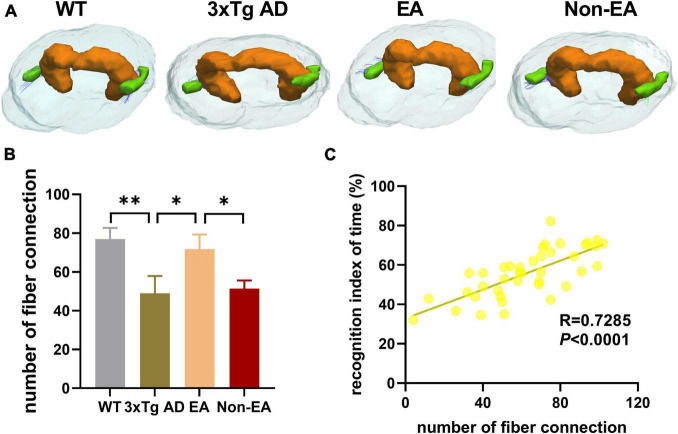
FIGURE 7.
Effects of the EA-treatment on fiber connection between the hippocampus and entorhinal cortex. (A) Representative image of connected nerve fibers between hippocampus and entorhinal cortex in all group. (B) Quantification of the number of nerve fibers connection between the hippocampus and entorhinal cortex, (C) and the correlational analysis between the recognition index of time and the number of nerve fibers connection (n = 10 in each group). All data represent the mean ± SEM. *P < 0.05; **P < 0.01.

