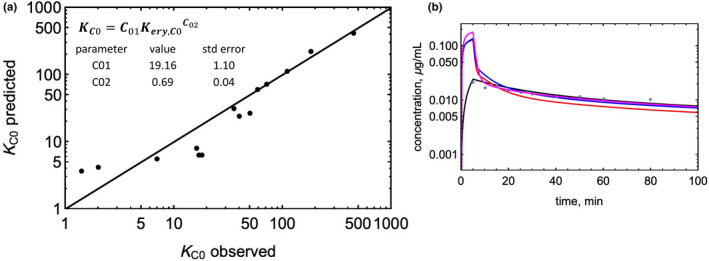
FIGURE 2.

Modeling a shallow distribution compartment. (a) Observed versus predicted partition coefficient (KC0) for the shallow compartment. (b) Impact of adding a shallow compartment on the predicted C‐t profile of metoprolol. Model‐predicted profiles are as follows: blue: RR model; red: Kp,mem model; magenta: PermQ model without a shallow compartment, black: PermQ model with a shallow compartment.
