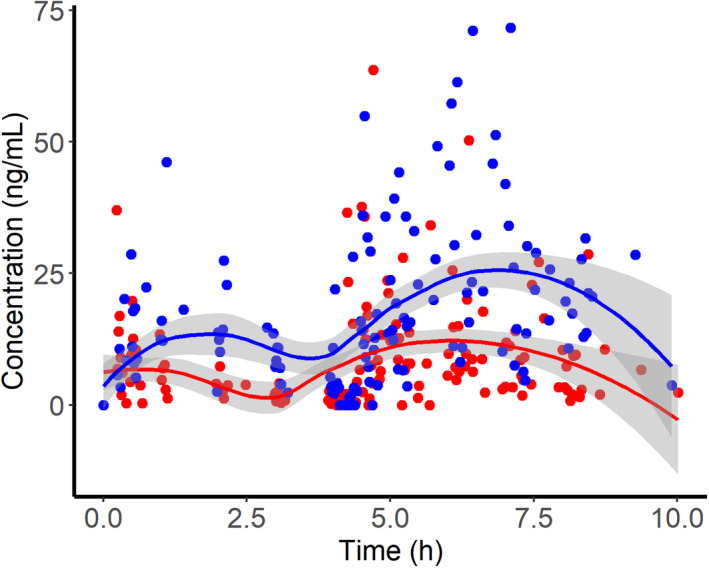
FIGURE 1.

Observed misoprostol acid plasma concentration versus time profiles following vaginal (blue) or buccal (red) administration of misoprostol (25 μg followed by 50 μg at 4 h). Lines and shaded areas indicate the median and 95% confidence interval of a Loess smooth function.
