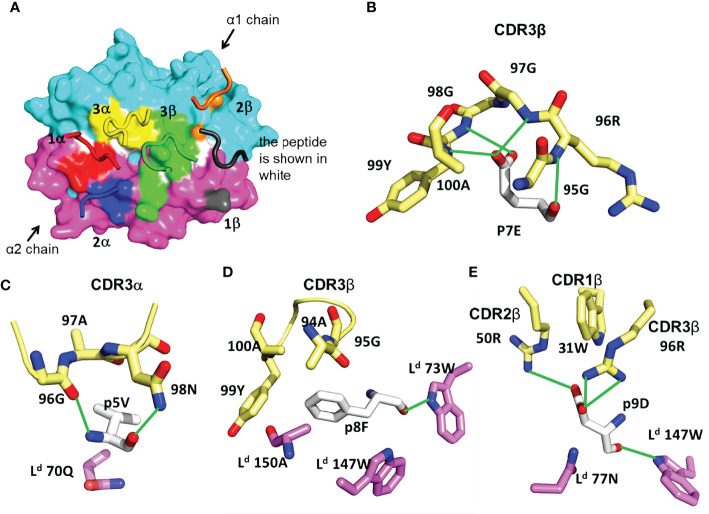
Figure 3.
Features of TG6 TCR bound to Ld-HF10 complex. (A) TCR footprint on the solvent-accessible surfaces of the Ld-HF10 complexes (Ld α1, cyan; Ld α2, magenta; peptide, white). The TCR CDR loops are colored as TCR footprint. Areas of TCR contact with pMHC (≤ 4.5Å) are colored as: CDR1α, red; CDR2α, blue; CDR3α, yellow; CDR1β, gray; CDR2β, orange; CDR3β green. (B-E), Interactions between TG6 CDRs and Ld-HF10. HF10 residues are shown in white carbon stick; residues on TG6 are shown in pale yellow carbon stick; residues of Ld are shown in magenta (α1) and cyan (α2) carbon stick; H-bonds and salt bridges are indicated by green lines. (B) Extensive contacts between TCR CDR3β and p7E of the HF10 peptide. (C) Residues of both TCR CDR3α and Ld contact HF10 p5V. (D) Hydrophobic stacking of TCR CDR3β and Ld with HF10 p8F. (E) Both TG6 CDR2β and CDR3β form a salt bridge to p9D. Ld also provides contacts. See Movie S2.

